Basic HTML Version


International Journal of Marine Science 2014, Vol.4, No.44, 1-14
http://ijms.biopublisher.ca
5
Table 2 Biometrical characteristics of elasmobranch fish caught in Sevastopol coastal waters (Black Sea, Ukraine)
Species
Total length, cm
Standard length, cm
Weight, g
Atlantic spiny dogfish (n=16)
32.2 – 53.4
44.32±1.27
30.1 – 50.8
41.87±1.24
105.9 – 652.96
319.2±33.01
Buckler skate (n=43)
21.0 – 68.5
42.52±1.45
16.4 – 41.6
23.95±0.98
115.01 – 196.62
460.04±62.43
Stringray (n= 31)
33.70-65.0
43.13±1.24
16.6 – 35.8
22.42±0.90
209.89 – 2399.0
592.59±87.34
Notes: Above the line - min-max, under the line - mean
±
SE, n - number of examined individuals
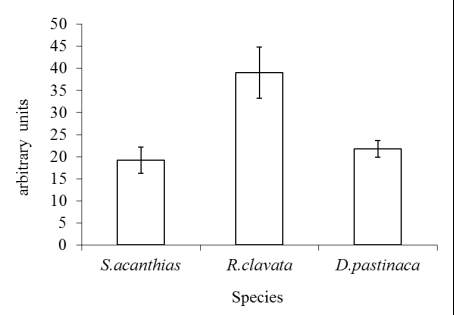
Figure 2 Oligopeptides concentration (mean ± SE, ×10
-3
mg
protein
-1
) in the liver of elasmobranch species caught in
Sevastopol Bay (Black Sea, Ukraine)
Antioxidant enzyme activities in the liver of
elasmobranch species are presented in Figure 3. SOD
activity was significantly higher (P<0.001) in the liver
of both skates as compared with the shark. Hepatic
enzymatic activity was greater in buckler skate than in
stringray (P<0.05). The highest CAT activity was
observed in the liver of buckler skate, it was
significantly greater (P<0.01) than in both examined
elasmobranchs.
Figure 3 Antioxidant enzyme activities (mean ± SE., mg
protein
-1
min
-1
) in the liver of elasmobranch fish species caught
in Sevastopol Bay (Black Sea, Ukraine)
PER and GR activities were significant higher
(P<0.05 and P<0.001 respectively) in both skates as
compared with shark, and no significant differences
were shown between skates.
High correlations were shown between the activity of
SOD and CAT (r=0.91), SOD and PER (r=0.94) and
between PER and GR (r=0.87). The relationships
between SOD and GR and CAT and PER were lower
(r=0.66 and r= 0.72 respectively).
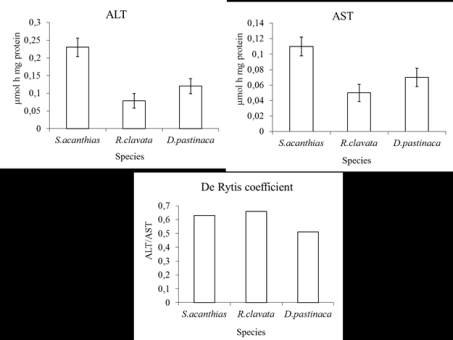
Aminotransferase activities and de Rytis coefficient
are shown in Figure 4. Both ALT and AST levels were
significantly higher in the dogfish than in both species
of ray (P<0.05). However, the de Rytis coefficient was
higher in both dogfish and buckler skate as compared
with stringray. As expected, high correlation was
shown between hepatic ALT and AST activity
(r=0.95).
Figure 4 Aminotransferase activities and de Rytis coefficient
(mean ± SE, mg protein
-1
h
-1
) in the liver of elasmobranch
species caught in Sevastopol Bay (Black Sea, Ukraine)
There was no significant difference in albumin
concentration in the liver of the examined
elasmobranchs (Figure 5). Though not significant, we
did note a decreased concentration of albumin in the
liver of stringray as compared with both dogfish and
buckler skate.