Basic HTML Version


International Journal of Marine Science 2014, Vol.4, No.43, 1-9
http://ijms.biopublisher.ca
7
are defined. The waves coming from the offshore
break in the nearshore section where sandy bars are
built as a result of sediment movements. An offshore
point at which sediment movements, resulting from
waves, become almost insignificant marks the
boundary between the nearshore and offshore zone;
this is the seaward end of a typical beach profile (at
a depth of approximately 10 m for the open seas). In
fact, waves break in the surf zone and rush up the
steep section of the beach profile, namely the
foreshore zone, or beach face. During higher water
levels wave action usually brings about scarps and
the backshore portion of the profile may include
more than one berm. At the shoreward end of a
typical beach profile sand dunes, resulting from
wind-blown sand, may be trapped by vegetation or
cliffs may exist.
It is conventional that a calm wave profile (summer
profile) is established after a period of low energy
wave action during which the beach face becomes
steeper as a result of the slight shoreward
movements of sediment, while a storm wave profile
(winter profile) is created when sand is transported
seaward resulting from high energy wave action
during storms (Dean and Dalrymple, 2002; Sorensen,
2006).
The beach face slope is related to both the wave
steepness and sand size. For example, a beach face
slope of around 1:10 to 1:15 can be observed on the
northern shore of New Jersey in the United States
where the median grain diameter is around 0.4 to 0.5
mm. Under the same wave energy conditions on the
southern beaches a median grain diameter of around
0.15 to 0.25 constructs beach face slopes of
approximately 1:40 (Sorensen, 2006). All previously
published researches have been done on open sea
coasts. For example, Figure 9 shows that while
beach face slope is dependent on the sediment grain
size, for low energy waves the beach face slope is
steeper than that when it is exposed to high energy
waves (Wright and Short, 1984). This
slope-sediment correlation has been observed by
many researchers, demonstrating steeper beaches
with coarser materials and vice versa, affected by
wave condition (Carter, 1998). Unlike other cases,
the Caspian Sea is not an open sea and this study
shows that this correlation exists between the
sediment grain size distribution and beach face slope
on the southern Caspian Sea sandy beaches (Figure
8). It can be clearly seen that the collected data are
in the range defined by, for example, Sorensen
(2006). There are some exceptions such as Chalus,
Mahmood Abad and Ramsar (for locations see
Figure 3). These beaches have very coarse grained
sand and gravel on their faces and do not fall into
the area between two curves related to low and high
energy waves. It should be noted that this does not
mean that these beaches, which are the coastal areas
of some famous northern cities of Iran, have coarse
sandy sediment along the whole of their length. For
example, Ramsar has a generally gravelly beach and
in some segments even boulders can be seen. As
another example, Mahmood Abad generally has
sandy beaches but some rivers flowing through them
into the Caspian Sea provide coarse material to form
local course grained beach faces. In contrast,
Gorganrood is a muddy coast dominated by silt and
clay which does not fall within the defined zone.
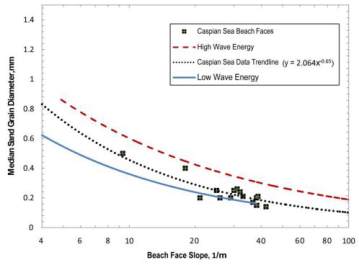
Figure 9 The correlation between median sediment grain size
and beach face slope on the southern Caspian Sea coast. The
solid blue and dotted red lines show the low and high wave
energy curves respectively defined by Sorensen (2006).
Sediment grain size data were obtained by
conducting laboratory tests on the sediment samples,
taken during the second survey, and beach face
slopes were measured from profile mappings. The
reason why the Caspian Sea data are accumulated
close to the low wave energy curve rather than the
high wave energy curve is that the second survey,
during which this data was collected, was conducted