Basic HTML Version


International Journal of Marine Science 2014, Vol.4, No.43, 1-9
http://ijms.biopublisher.ca
6
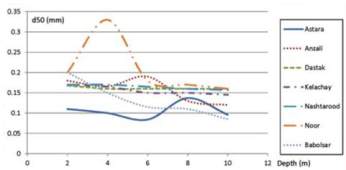
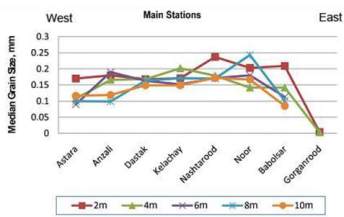
during the third survey. The plots in Figure 6 show
the median sediment grain size at depths of 2, 4, 6, 8
and 10 m for 8 main stations. In general, the median
sediment grain size exhibits an increasing trend from
west to east between Astara and Noor then a
decreasing trend from Noor to Gorganrood. This
trend follows both the nearshore gradient trend and
offshore gradient trend.
Table 1 The percentage of silt and clay along the profiles at main stations
Depth (m)
Astara
Anzali
Dastak
Kelachay
Nashtarood
Noor
Babolsar
Gorganrood
2
15%
0%
0%
3%
0%
0%
0%
90%
4
25%
0%
5%
11%
0%
0%
0%
99%
6
40%
2.5%
8%
15%
9%
0%
25%
-
8
36%
13%
15%
20%
12%
0%
29%
-
10
38%
18%
17%
25%
13%
0%
32%
-
Figure 5 Median sediment grain size along profiles at main
stations.
Figure 6 Median sediment grain size measured at depths: 2, 4,
6, 8 and 10 m for 8 main stations of the third survey.
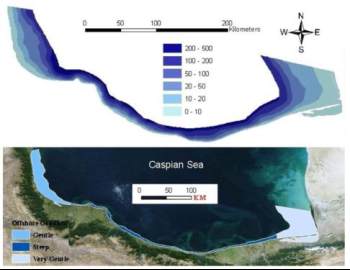
A comparison between these results and Figure 7
reveals that the sediment grain size along the
southern Caspian Sea coast is controlled by
bathymetry of the sea, i.e. the steeper the coasts, the
coarser the grain size. There are at least two simple
reasons why this should be so. Firstly, coarser
materials that are transported towards shore tend to
be retained on the beach due to relative immobility
and asymmetry of the incident wave. This makes a
steep slope because for coarser material the angle of
repose, the steepest angle at which a pile of
unconsolidated grains remains stable, is larger than
for fine materials. Secondly, beaches formed by
coarse grained sediment are more stable in
high-energy conditions due to their high
permeability and roughness.
Figure 7 Top: Caspian Sea bathymetry (data from Iran’s
Caspian Sea National Research Centre).
Bottom: Coastal classification based on offshore gradient
along Iran’s Caspian Sea coast.
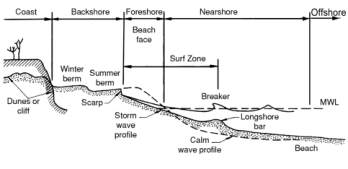
The most obvious changes along a beach profile
occur in the beach face part which is directly
exposed to incident waves (Figure 8).
Figure 8 Schematic typical beach profile, terminology and
zonation (after Sorensen, 2006).
Beaches worldwide are similar in composition and
shape. Figure 8 depicts a typical cross-section of a
beach perpendicular to the shore, where four general
zones of a typical beach profile that extends from
the cliff or dunes to the end of the nearshore zone