Basic HTML Version


International Journal of Marine Science 2014, Vol.4, No.23, 210-218
http://ijms.biopublisher.ca
214
Table 2 BEST results for total groups
SI NO.
Variables
VARIABLES SELECTED
BEST CORRELATION VALUES (Rho)
1
2
3
4
5
6
7
8
9
10
11
12
Temperature
pH
Salinity
Carbon di oxide
Dissolved Oxygen
Conductivity
TDS
Turbidity
Phosphate
Silicate
Nitrate
Nitrite
3,6,11,12
6,9,11
3,6,9,11
6,11,12
6,9,11,12
3,6,9,11,12
3,6,11
3,11,12
3,6,7,11,12
6,11
3,6,7,9,11,12
3,6,7,9,11
0.139
0.136
0.133
0.133
0.131
0.127
0.121
0.108
0.108
0.107
0.102
0.102
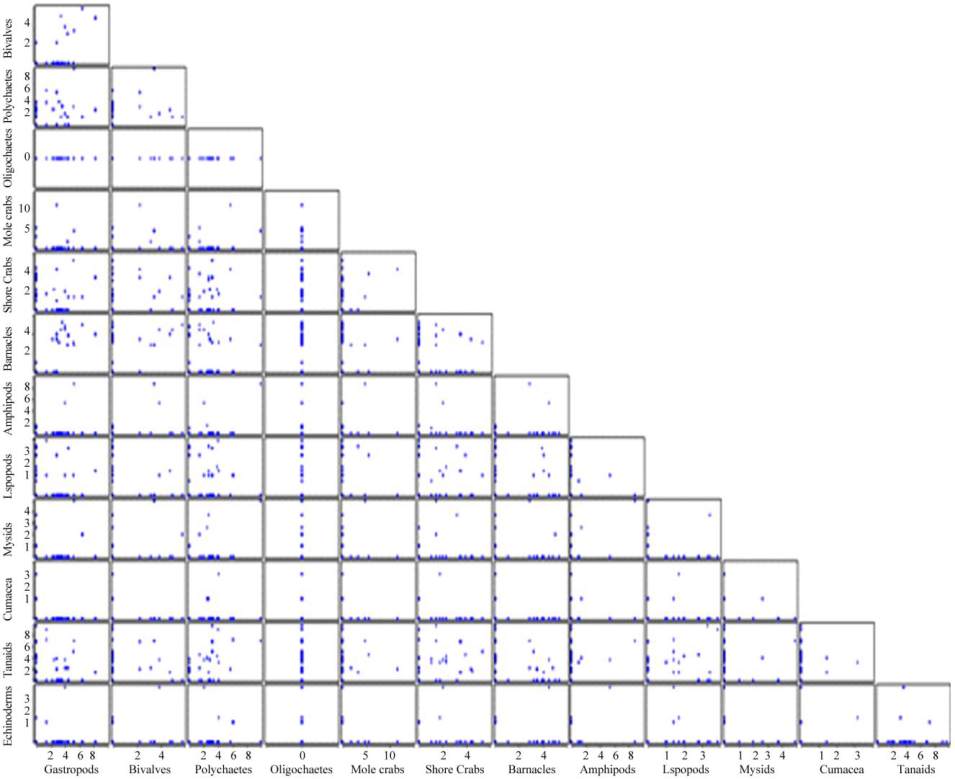
Figure 6 Draftsman plot showing correlations between faunal groups for all the stations
The dynamics of an ecosystem has been determined by
the interactions between and within the communities. The
significant correlation has been showed by some groups.
Barnacles and gastropods showed high significance (0.825)
followed by bivalves and gastropods (0.660), mysids and
amphipods (0.599), tanaids and polychaetes (0.517).