Basic HTML Version


International Journal of Marine Science 2014, Vol.4, No.23, 210-218
http://ijms.biopublisher.ca
215
1.5 Non-metric multidimensional scaling bubble plots
The Figures 7, 8 & 9 show the results of ordination of
polychaetes, gastropods and total groups of the
studied area. As polychaetes and gastropods form the
dominant organisms on Dharmadam beach, they have
picked for MDS and bubble plot scaling to show the
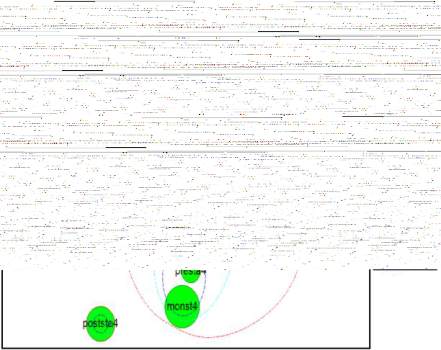
presence and dominance of the same. In Figure 7
bubble plot of total group of Dharmadam beach has
been disclosed. The bubbles are used to explore the
relative sizes of variables assist in exploring the trends
in variables between samples (Clarke and Warwick,
2001). In the figure bubbles were drawn based on
relative abundance of dominant group of macro
invertebrates. Here it clearly shows that the gastropod
components are abundant during almost all seasons.
According to the size of the bubble, monsoon season
(at station 2) showed highest abundance of gastropods.
Ordinations based on MDS bubble plot of polychaetes
on monthly basis were also done (Figure 8) as the
polychaetes formed one of the dominant organisms in
Figure 7 Bubble plot showing seasonal variations in total
groups from Dharmadam beach. (monst - monsoon season,
postst - post monsoon season, prest - pre monsoon season)
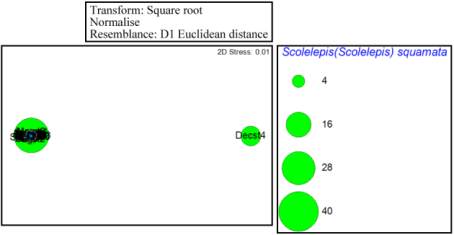
Figure 8 Bubble plot showing monthly variations in polychaetes
from Dharmadam beach. (Decst - December month)
the study area. The segregation of a bubble (Figure 8)
clearly shows the abundance of
Prionospio
sp. in
December, 2009. It reveals the reason of dissimilarity
with other, while the others having an abundance of
the species
Scolelepis (Scolelepis) squamata
. The
bubble plots enlightens the fact on the dominance of
gastropods and polychaetes in Dharmadam beach.
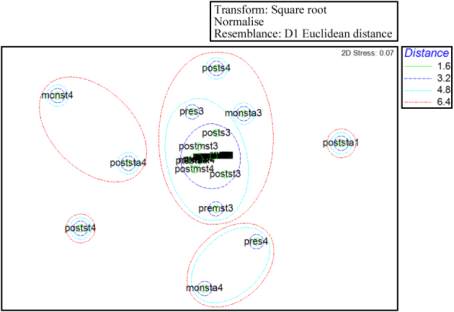
The MDS plotting (based on Euclidean distance to
find the distance/dissimilarity between samples) of
gastropods (Figure 9) another dominant group of that
area shows that majority of the samples grouped
closely and can assume that almost similar in
composition. But two stations in the post monsoon
season formed two separate groups. These separated
stations in post monsoon season have different
composition of species when compared to closely
related stations. Samples grouped within the red
circles showing significantly separate groups at an
Euclidean distance of 6.4.
Figure 9 MDS plot of gastropods from Dharmadam beach.
(Normalise variables, Square root transformation). (monst -
monsoon season, postst- post monsoon season, prest -
premonsoon season)
2 Discussion
2.1 Abundance and Influence of environmental
gradients on macrofauna
The life and living in these zones are big challenges to
the animals here. They are persistently facing fluctuating
salinity, drying out by wind and sunlight, predators,
strong currents that carry them back to the sea and
changing weather conditions. Sedimentation, light,
moisture, and temperature variations are also common.
As a first study on that beach, this reveals that the
beach system supports high abundance of two or three