Basic HTML Version


International Journal of Marine Science 2014, Vol.4, No.20: 183-193
http://ijms.sophiapublisher.com
189
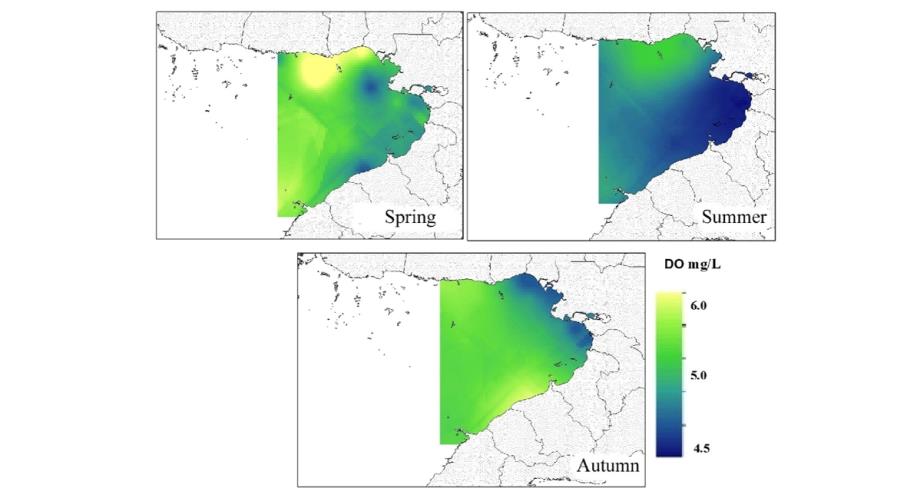
Figure 8 Horizontal distribution of dissolved oxygen (mg/L) in Guacanayabo´s Gulf in spring, summer and autumn. The maximum
values are displayed in the North in spring and in the South in autumn, while the minimum are in the East.
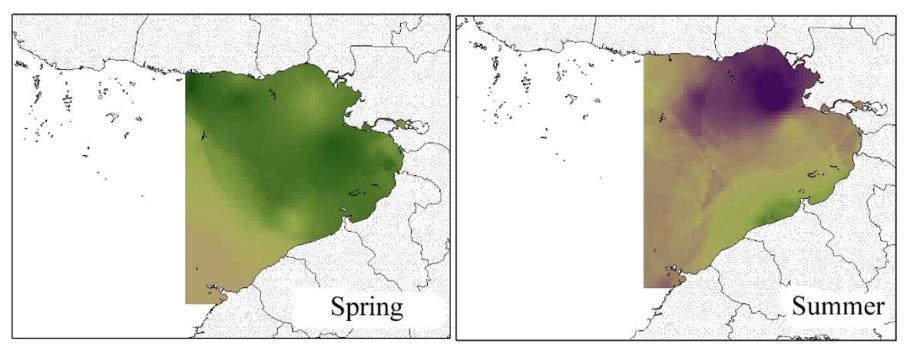
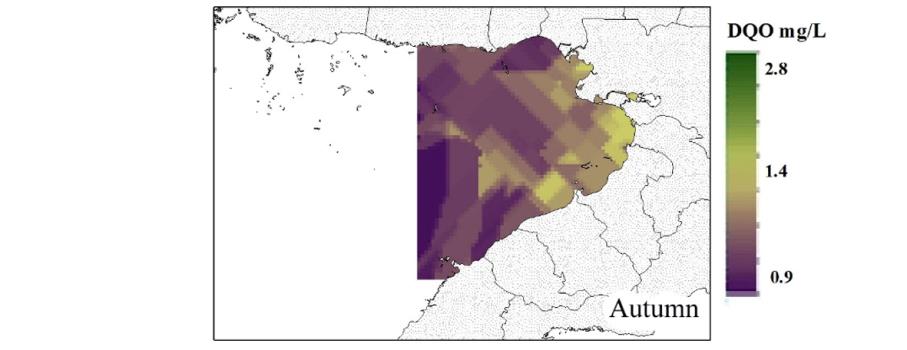
Figure 9 Horizontal distribution on chemical demand of oxygen (COD, mg/L) in spring, summer and fall. Maximum values are
registered in zones with more runoff of rivers and anthropogenic wastes while, minimum ones are shown in renovation waters.