Basic HTML Version


International Journal of Marine Science 2013, Vol.3, No.34, 267-277
http://ijms.sophiapublisher.com
274
Table 1 Cross-correlations between various index-area 1-100 m depth-averaged and surface parameters
Annual
T
U
V
W
S
Y
X
U
0.89
V
-
0.83
-
0.98
W
-
0.90
-
0.98
0.96
S
0.80
0.56
-
0.44
-
0.63
Y
-
0.89
-
0.98
0.99
0.96
-
0.51
X
-
0.08
-
0.22
0.35
0.19
0.04
0.29
CHL
-
0.80
-
0.74
0.72
0.83
-
0.66
0.76
0.00
Monthly
T
U
V
W
S
Y
X
U
0.39
V
-
0.13
-
0.78
W
-
0.36
-
0.65
0.62
S
0.60
0.37
-
0.25
-
0.22
Y
-
0.21
-
0.60
0.65
0.87
-
0.03
X
0.15
0.11
-
0.02
-
0.20
-
0.02
-
0.18
CHL
-
0.28
-
0.34
0.33
0.51
-
0.14
0.47
-
0.44
Anomaly
T
U
V
W
S
Y
X
U
0.36
V
-
0.06
-
0.68
W
-
0.36
-
0.43
0.33
S
0.60
0.42
-
0.32
-
0.31
Y
-
0.15
-
0.26
0.27
0.50
0.02
X
0.14
0.18
-
0.12
-
0.42
-
0.03
-
0.58
CHL
-
0.19
-
0.18
0.13
0.25
-
0.05
0.21
-
0.39
Note: Values significant above 95% confidence are bold (annual>0.8, monthly>0.5, anomaly>0.3). T=temperature, U=zonal current,
V=meridional current, W=vertical motion, S=salinity, Y=meridional wind stress, X=zonal wind stress, CHL=chlorophyll. Time
period is 1990-2008 except CHL 1998-2008
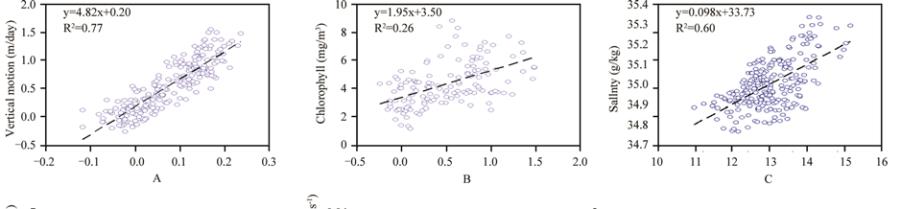
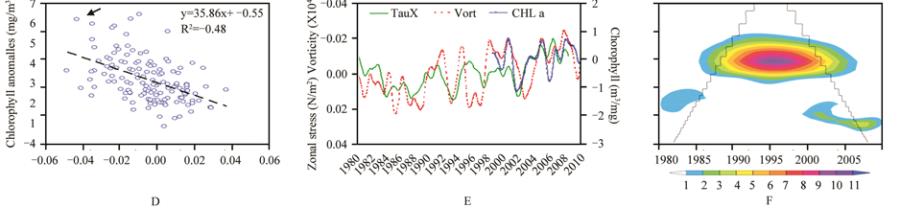
Figure 8 Scatterplots of monthly index-area: a) meridional wind stress (Y) and SODA 1-100 m vertical motion (W), b) 1-100 m
vertical motion and MODIS chlorophyll, and c) SODA 1-100 m temperature and salinity. d) Scatterplot of 1-month lagged, 2-month
smoothed zonal wind stress and chlorophyll anomalies. e) Smoothed SeaWifs/MODIS chlorophyll (thick), (inverted) CFS wind
vorticity (dashed) and SODA zonal wind stress and f) SODA zonal wind stress wavelet spectral energy (years) with cone of validity
and >95% significant power shaded
Note: Arrow in d) refers to case study in Figure 9. Chlorophyll data starts in 1998, others in 1980