Basic HTML Version


International Journal of Marine Science 2013, Vol.3, No.34, 267-277
http://ijms.sophiapublisher.com
273
3.3 Inter-Relationships
The foregoing suggests that CFS and SODA reanalysis
products adequately represent coastal upwelling in the
southern Benguela. Consequently attention is turned
to statistical relationships in the St Helena Bay
sub-area. The index-to-field correlation of annual CFS
SST has r>0.9 oriented along the shelf edge (Figure 7a)
suggesting a shared response to inter-annual variations
of upwelling, and de-correlation scales: x=60km,
y=300km. Monthly meridional currents increase in
summer as longshore winds and SST rise (cf. Figure
5b, c) so r>0.4 extends along the coast (Figure 7b).
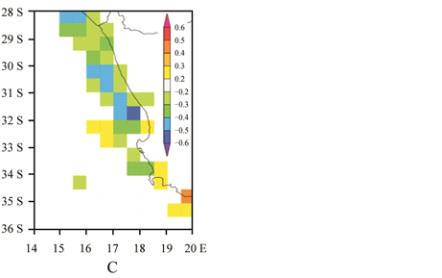
Upward motion along the coast north of St Helena
Bay corresponds with lower SST (r<-0.4; Figure 7c)
suggesting a ‘downstream footprint’.
Figure 7 a) Correlation of SST index (averaged over dashed
box) with annual CFS Ts field. Correlation of SST index with
monthly SODA 1-100 m layer: b) meridional current and c)
vertical motion
Note: Correlation scales vary, blank areas have lower
significance. Analysis is over 1980-2008
Cross-correlations between SODA parameters in St
Helena Bay at different time scales are given in Table 1.
The annual cycle of upper layer T and W, and
meridional wind stress (Y) and currents (V) are
closely tied as expected (Table 1, r=-0.90; r=0.99
respectively). While zonal currents (U) gradually
strengthen from October to February, there are weak
mean winds and vertical motion from May to
September (cf. Figure 6a, d).
Scatterplots of monthly SODA vertical motion (W)
and meridional wind stress (Y) yield a linear
regression slope 4.82 m d
-1
/N m
-2
, r=.87 (Figure 8a).
Vertical motion in turn, affects chlorophyll (slope 1.95
mg m
-3
/m d
-1
, r=.51, Figure 8b). Temperature and
salinity vary together (slope .098 g kg
-1
/
℃
, r=0.60) in
conjunction with the zonal overturning circulation (U
and T r=0.39, U and S r=0.37; Table 1). The
coincidence of temperature and salinity (Figure 8c) is
expected from advection and ‘matching’ structure (cf.
Figure 6b, f). The dynamical relationships support
theory W = Y/Lρf + ΔU/L (Veitch et al., 2010),
defined as: upwelling W equals the longshore wind
stress (Y 10
-1
) divided by offshore length scale (L 10
4
),
water density (ρ 10
3
) and coriolis parameter (f 10
-4
),
plus the gradient of zonal transport (ΔU/L 10
-5
).
Inter-annual relationships are studied in Table 1 lower
using anomalies (annual cycle removed). Many results
are anticipated: U and T r=0.36, U and W r=-0.43, T
and S r=0.60, Y and W r=0.50. Yet an interesting
result is the SODA-ECMWF zonal wind stress (X)
relationship with W (r=-0.42) and CHL (slope -35.86
mg m
-3
/N m
-2
, r=-0.39), wherein offshore flowing
winds enhance coastal uplift and phytoplankton
blooms. No other ocean variable is as closely related
to chlorophyll anomalies in the period 1998-2008. The
scatterplot (Figure 8d) indicates that chlorophyll
enrichment in the southern Benguela follows offshore
(
-
X) winds, when the South Atlantic high ridges
south of Africa. Time series of wavelet-smoothed
chlorophyll, wind vorticity and zonal wind stress are
given in Figure 8e. Chlorophyll rises with cyclonic (-)
wind vorticity, as expected. The zonal wind stress
exhibits significant ~5 year oscillations (Figure 8f)
consistent with fluctuations in chlorophyll (r=
-
0.59)
and fish catch (cf. Jury, 2012). Both zonal stress and
vorticity time series exhibit a trend toward offshore
cyclonic flow: linear fit r=-0.53 consistent with
trends in the southern annular mode (White, 2004;
Arblaster and Meehl, 2006; Ding et al., 2012) and
poleward drift of the sub-tropical anticyclone. There
is also a cooling trend in St Helena Bay SST (slope
-
0.017C/yr, r=
-
0.50).