Basic HTML Version


International Journal of Marine Science 2013, Vol.3, No.2, 4
-1
6
http://ijms.sophiapublisher.com
9
Table 2
Species composition, mean CPUE (number of fish per
operation) and standard deviation (SD) of shell fishes collected
from estuarine upper zone (EUZ) and estuarine marine zone
(EMZ) of Kodungallur-Azhikode estuary (KAE) during July
2009-2010 period
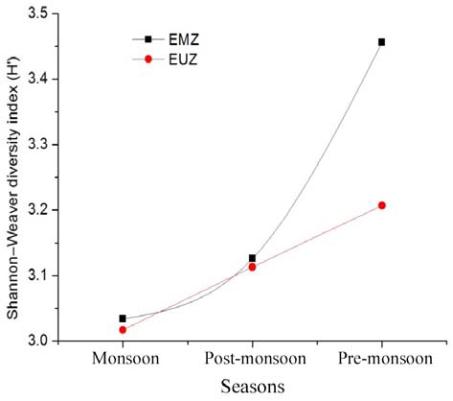
Figure 1
Seasonal variation of fish diversity in the Kodungallur-
Azhikode estuary during 2009-2010.
2.3 Fish assemblage – environmental relationships
and landing pattern
The direct gradient analysis, using CCA approach,
elucidated the role that the measured environmental
variables played in shaping assemblage structure by
comparing the species compositions among the
collections from each zones. A test of significance
(p=0.005) of all canonical axes using a Monte–Carlo
permutation and a relatively high ratio of the sum of
all canonical eigenvalues to the sum of all
unconstrained eigenvalues indicates that the selected
environmental variables are influential in driving the
variation in the fish assemblages. The direct gradient
analysis can be summarized on a two-dimensional plot,
because 72% of the cumulative percent variance, of
this species-environment relationship, was explained
on the first two CCA axes. The first CCA axis, which
explained most of the variation (45%) in the species
data, was related to transparency, pH and salinity. The
relatively large vectors representing salinity, pH and
transparency the parallel orientation of these three
vectors with axis 1, indicate their importance in
shaping assemblage structure across the study site.
Variation along the second CCA axis was driven by
depth, turbidity and BOD (Table 3). The direction of
the depth vector was towards the monsoon season
(Figure 2), indicating the relative importance of each
of these variables in shaping these assemblages
(Table 4, 5).
Table 3
Environmental variables and Standard deviation (SD)
of estuarine upper zone (EUZ) and estuarine marine zone
(EMZ) of Kodungallur-Azhikode estuary (KAE) during July
2009-2010 period
EMZ SD
EUZ
SD
Salinity (psu)
16.41
8.90
12.31
7.71
Temperature (
℃
)
28.68
1.42
29.16
1.51
Depth (m)
3.76
0.07
3.27
0.26
Transparency (m)
1.00
0.42
0.97
0.28
Turbidity (NTU)
9.94
10.16
9.54
8.23
pH
7.41
0.43
7.29
0.39
DO (mg/L)
4.89
0.52
5.47
0.82
BOD (mg/L)
2.57
0.18
2.53
0.99
NO
3
-N (µmol/L )
9.30
8.89
11.44
6.99
NO
2
-N (µmol/L
)
0.34
0.13
0.27
0.12
NH
4+
N (µmol/L
)
4.65
1.72
4.30
0.96
PO
4
-P (µmol/L
)
1.05
0.68
0.98
0.66
SiO
3
-S (µmol/L
)
45.99
6.36
53.34
14.94
Chl-
a
(mg/m)
6.03
2.43
6.93
4.21
EMZ
EUZ
Species
CPUE
SD
CPUE SD
Fenneropenaeus
indicus
250.00
86.60 272.00 21.17
Penaeus monodon
12.67
6.43
11.33 4.62
Penaeus
semisulcatus
12.00
11.36
21.33 6.51
Metapenaeus
monoceros
14.67
2.52
14.67 6.03
Metapenaeus
dobsoni
268.00
75.97 250.00 54.37
Metapenaeus affinis
11.33
3.51
12.67 13.61
Macrobrachium
rosenbergii
2.00
2.65
2.33 0.58
Scylla serrata
8.00
6.00
8.00 8.72
Scylla tranquebarica
0.33
0.58
0.00 0.00