Basic HTML Version


International Journal of Marine Science 2013, Vol.3, No.2, 4
-1
6
http://ijms.sophiapublisher.com
10
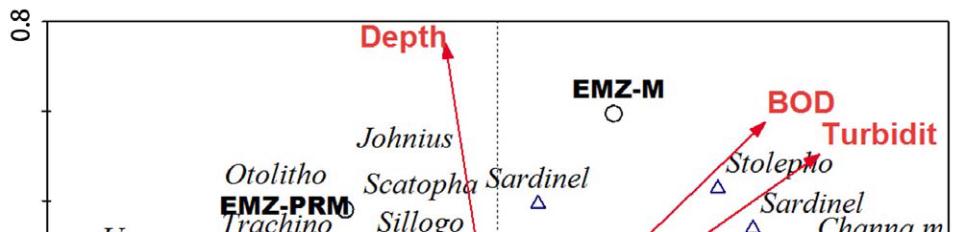
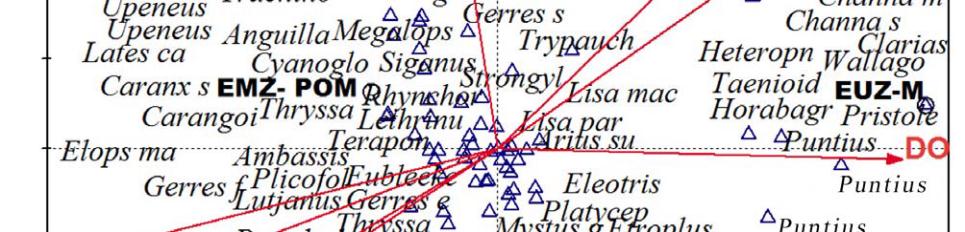
Figure 2 CCA ordination using all samples during the period from 2009 to 2010.
Note: Axis 1 explained 45.1% and axis 2 explained an additional 74.6% of the variation in the species data. EMZ-M (Estuarine
marine zone - monsoon), EMZ - POM (Estuarine marine zone - post monsoon, EMZ-PRE (Estuarine marine zone - pre monsoon),
EUZ-M (Estuarine upper zone - monsoon), EUZ - POM (Estuarine upper zone - post monsoon, EUZ-PRE (Estuarine upper zone -
pre monsoon).
Table 4 Results of CCA on all samples
CCA
axis 1
CCA
axis 2
CCA
axis 3
CCA
axis 4
Total
inertia
Eigenvalues
0.123 0.074 0.036 0.028 0.273
of
species
data
45 72.3 85.5 95.6
-
Cumulative
percentage
variance
of species
environment
relation
45 72.3 85.5 95.6
-
Sum of all eigenvalues
- -
-
-
0.273
Sum of all canonical
eigenvalues
- -
-
-
0.273
Table 5
Inter-set correlations of environmental variables with
CCA axes
Environmental
variable
CCA
axis 1
CCA
axis 2
CCA
axis 3
CCA
axis 4
Salinity
-0.8444 -0.2162
0.1654
-0.4561
Temperature
-0.6137 -0.4051
-0.5848
0.2925
Depth
-0.1163 0.7516
0.3786
-0.5115
Transparency
-0.6646 -0.407
0.1394
-0.6091
Turbidity
0.7144 0.5037
-0.0216
0.4796
pH
-0.8644 -0.3306
0.0338
-0.375
DO
0.8991 -0.0247
0.0344
-0.0039
BOD
0.5936 0.5751
-0.2441
-0.1489