Basic HTML Version


Int. J. of Marine Science 2012, Vol.2, No.7, 51
-
56
http://ijms.sophiapublisher.com
53
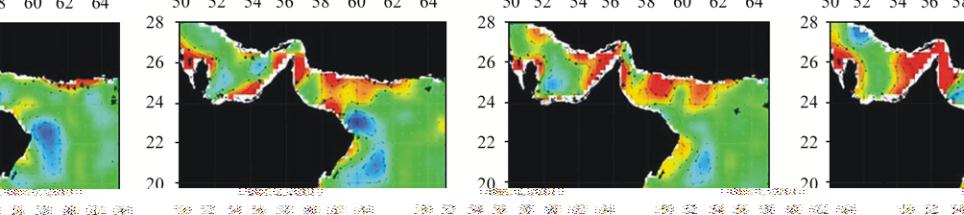
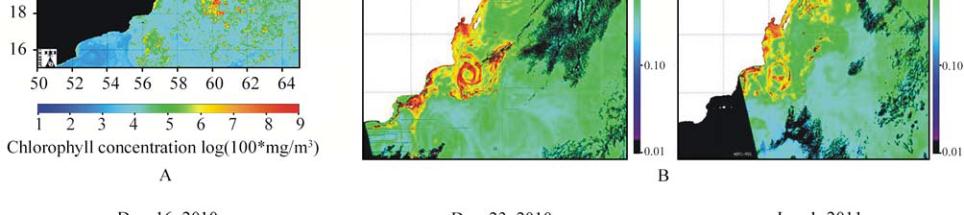
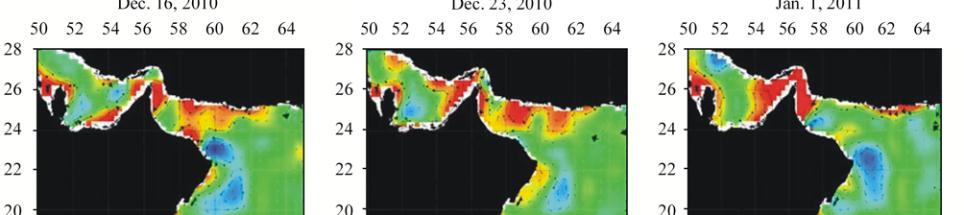
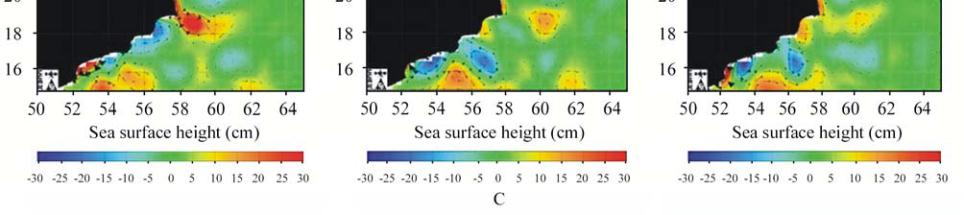
Figure 2
Eddy field: an example of sea surface height and chlorophyll-
a
distribution
Note: A: chlorophyll-
a
Level 3 product (MODIS-Aqua scanner); B: chlorophyll-
a
, December 12 (left) and 14, 2010. Level-2 images
provided by the ROPME Remote Sensing Group; C: sea surface topography (TOPEX/POSEIDON data). Maps were produced by the
CCAR Global Near Real-Time SSH Anomaly/Ocean Color Data Viewer.
range from 1997 to 2008. The weekly time series
subjected to spectral analysis have implied both
parameters exerting fluctuations with some matching
dominant periods. The annual and semiannual
periodicity dominated the variability of chlorophyll-
a
concentration, whereas the kinetic energy spectrum had
peaks at 4 years, 1 year, and the 6~7 month period.
In tracing the passage of eddies through the region, we
have noticed a diversity of directions represented by
southward, eastward, and westward propagation.
Global generalization of mesoscale eddies in the World
Ocean has pointed out that these eddies propagate west
at the phase speed of nondispersive baroclinic Rossby
waves, with a general preference of the cyclonic eddies
to move poleward, while anticyclonic eddies tend to
move towards the equator (Chelton et al., 2007). It goes
without saying, that the tendencies of tracks inferred
through global generalization may not be the case for a