Basic HTML Version


Int. J. of Marine Science 2012, Vol.2, No.7, 51
-
56
http://ijms.sophiapublisher.com
52
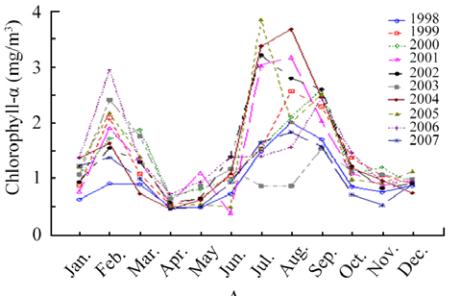
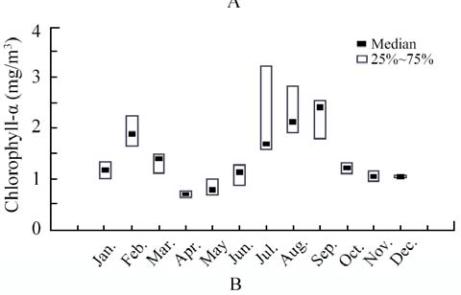
Figure 1 Seasonal cycle of remotely-sensed chlorophyll-
a
concentration (1998~2007)
Note: A: various years (1998~2007); B: averaged seasonal cycle
The kinetic energy of eddies has experienced seasonal
changes as well. However, the seasonal variation of
kinetic energy was not pronounced as clear as for the
chlorophyll concentration. The maps of chlorophyll
and sea surface heights both showed marked
spatial-temporal variability of the eddy field (Figure 2).
One could notice the presence of cyclonic and
anticyclonic eddies as well as their shifts characterizing
propagation to the south, south-west, and south-east.
The analysis of weekly time series of the sea surface
height maps has implied that some of these eddies were
keeping more or less stationary location while the
others were actively moving. The stationary eddies
were associated with the region of capes (in particular
with the Ras al Hadd region of the Oman coast), where
the confluence of two currents along the continental
shelf form the paired system-with the cyclonic eddy to
the north and the anticyclonic eddy to the south of this
confluence. The other eddies have originated in the
open ocean and propagated through the region.
The analysis of the relationship between the kinetic
energy of eddies and chlorophyll concentration gave
two types of statistically significant correlations-
positive and negative (Figure 3).
In maps and time series, the footprints of cyclonic
eddies were denoted by negative values of sea surface
heights whereas the anticyclonic eddies had positive
values.
We calculated the balance between negative and
positive sea surface height anomalies in time series
(Figure 4). For some years, the total annual balance of
negative to positive sea surface heights (cyclonic to
anticyclonic eddies) was negative. These years (Figure
3 A, B) were featured by positive correlation showing
that the cyclonic eddies dominated throughout the year
and the chlorophyll
-a
concentration was positively
related to the sea surface heights acting as the indicator
of the upward directed vertical component of currents
of an eddy field.
For the other years, the total annual balance of negative
to positive sea surface heights (cyclonic to anticyclonic
eddies) was positive. These years (Figure 3 C, D) were
featured by negative correlation showing that
anticyclonic eddies dominated throughout the year and
the chlorophyll-
a
concentration was negatively related
to the kinetic energy (due to the dominating downward
directed vertical component of currents of an eddy
field). The ratio between positive and negative sea
surface heights is exemplified in Figure 4 and Figure 5.
These figures show the dominance of cyclonic or
anticyclonic eddies for the year 2002 and 1998
correspondently. So in terms of interannual variability,
in the years with prevailing cyclonic eddies the
chlorophyll-
a
concentration will be higher than normal
(compared to interannual mean). In the years with
prevailing anicyclonic eddies (suppressing injection of
nutrients in the upper mixed layer) the chlorophyll
concentration will be less than normal. Weekly time
series of chlorophyll-
a
and kinetic energy have also
allowed us to seek long-term trends in parameter
variability. Apparently, no statistically significant
rising or declining tendencies were found, for the time