International Journal of Marine Science, 2017, Vol.7, No.3, 19-30
20
level had been increased about 110-135 meters after last glacial phase 18000 years ago (Feng et al., 2014).
Geological clues approved that ocean level had been increased about 20-25 meters during early Holocene
(7000-9500 years ago) (Warner et al., 2008). At that time the most volcanic activity had occurred and then the
huge drought had destructed the Acadian empire in low latitude in mid- Holocene (4200-3800 years ago) (Warner
et al., 2008). And the vast drought had been spread globally and Maya civilization in south American extinct in
late Holocene (1000-1500 years ago) (Mamedov, 1997). So the fluctuation of sea level around the world was
popular event during Holocene epoch. Now a day the human impact has caused the rate of sea level changing
varied all around the world. Caspian Sea morphological figures are different around marginal coasts and sea floor
(Mammadov and Khoshravan, 2012). And it can effect on erosion hazard impact and coastal vulnerability
(Khoshravan, 2014). Low steepness beach in the north, north east to east have high inundation vulnerability when
Caspian Sea arise (Khoshravan, 2014). On the other hand, the western and southern coasts of Caspian Sea with
high steepness beach have low inundation risk (Khoshravan, 2014). The most important aims of this paper are,
Caspian Sea level changing analysis in the past, recent and future and the introducing main characteristics of
Caspian Sea hydromorphology.
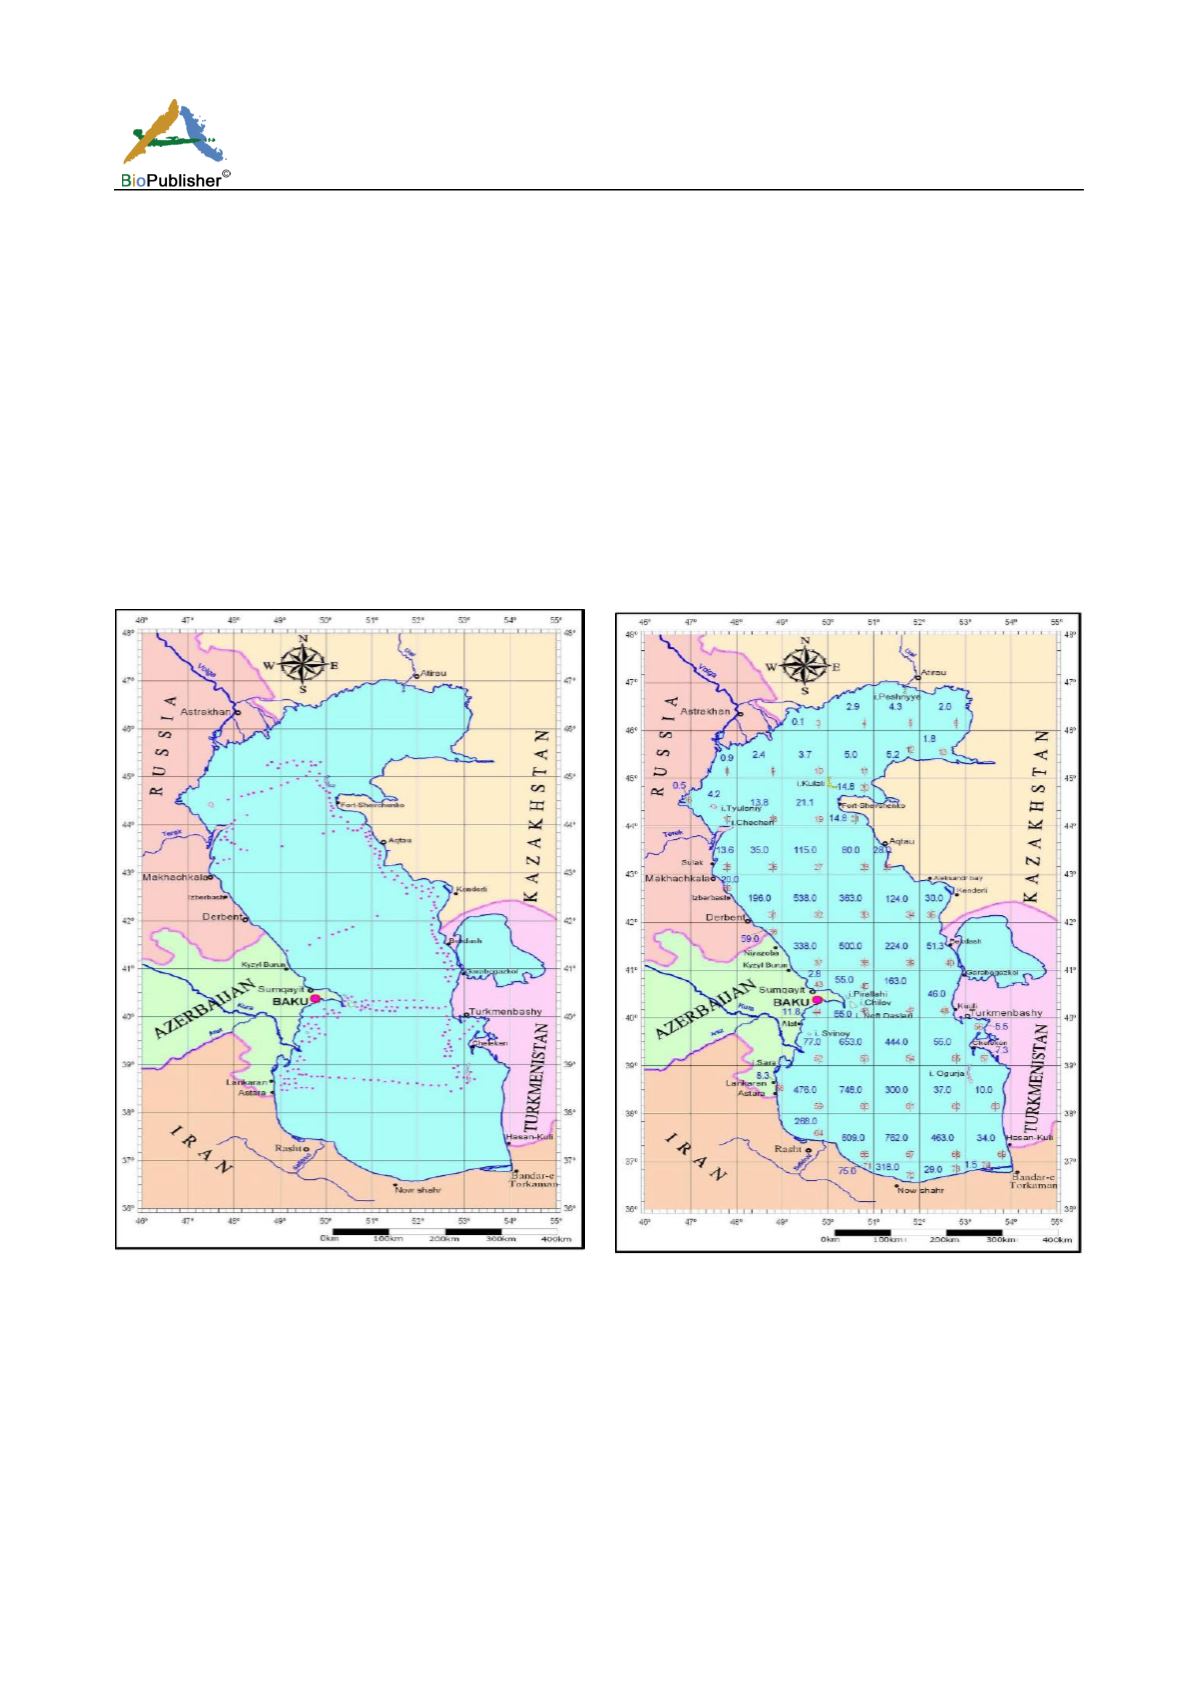
Figure 1 The position of Russians centennial measurement
transects on the Caspian Sea
Figure 2 Caspian Sea division for processing the
Hydromorphology data
1 Materials and Methods
In preparation of the present paper, the observatory data mentioned in marine calendars of Caspian Sea level
changing related to years between 1830 and 2015 were used. For drawing bathymetry maps, first the Caspian Sea
map in the scale of 1:1500000 was divided to 74 half degree squares in the environment of vector processing
software (Figure 2). Then, the mean values of sea depth were defined in these squares (Figure 2). For each of the
squares, the pitch is calculated using the X= tang a/b formula (a is the difference between two depths in one
square and b is the distance between two depths. In this map, in addition to isobaths curves, the depth of various
parts of Caspian seabed are presented (Figure 2). The depths are defined in proportion to the surface level of -28
from the Baltic Sea water level. The Caspian Sea Geomorphology map contains bathymetry figures, seabed slope


