International Journal of Aquaculture, 2017, Vol.7, No.20, 126-133
129
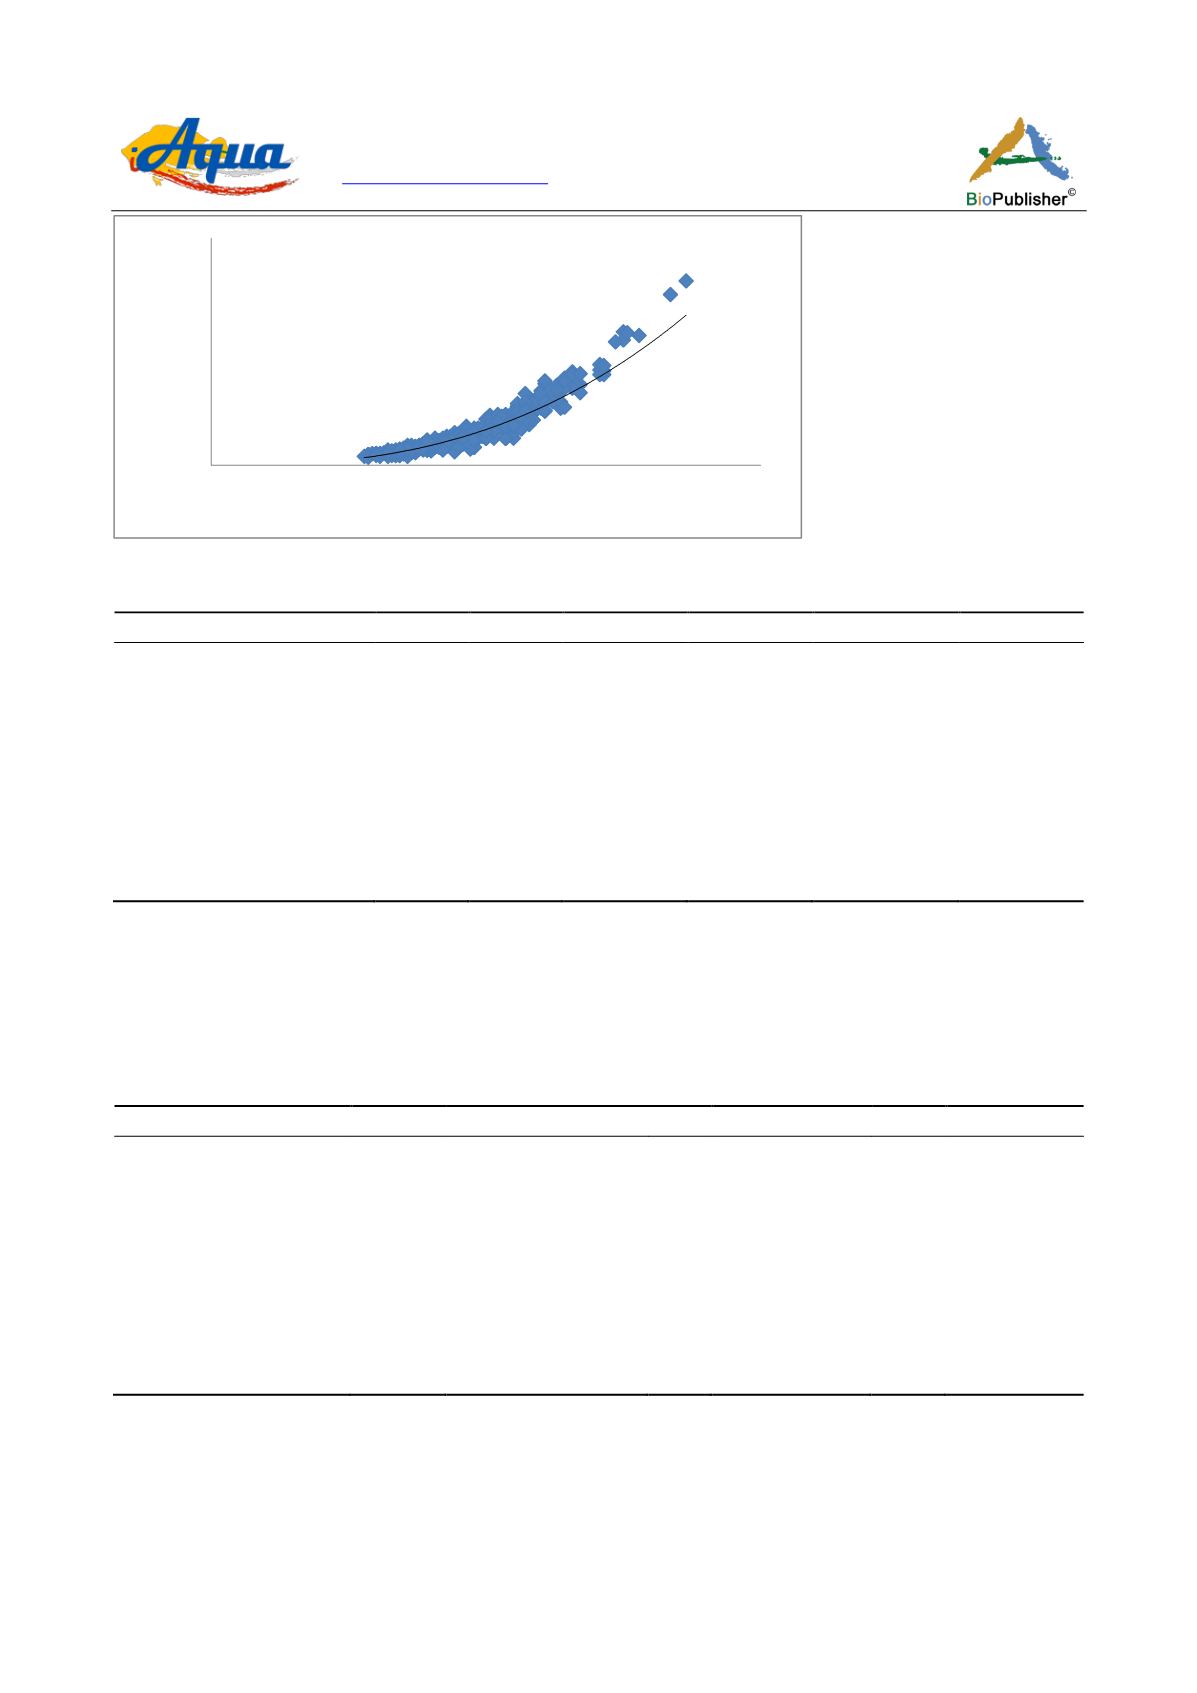
Figure 3 Length-Weight relationship for
G.quadrimaculata
Table 3 Average condition factor values for the fish species in River Debbis
Species
No
Sites
K (Min)
K(Max)
Mean of K
SD of K
V.beso
191
Deb
1
0.754
1.709
1.24
0.13
159
Deb
2
0.864
2.720
1.31
0.23
133
Deb
3
0.475
1.983
1.20
0.22
G. chebera
297
Deb
1
0.338
2.194
1.24
0.16
260
Deb
2
0.636
2.454
1.32
0.24
160
Deb
3
0.881
2.221
1.30
0.19
G.quadrimaculata
309
Deb
1
0.657
1.886
1.22
0.21
178
Deb
2
0.626
1.76
1.20
0.19
112
Deb
3
0.629
1.865
1.14
0.18
In general the mean K values of female
G. chebera
were higher than males at all sites (Table 4). However, the
mean K values of females
G. quadrimaculata
was lower than males at Deb
1
and Deb
3
sites with mean K values
1.23 ±0.09 and 1.21 ±0.16 respectively. But, it was higher than males at site two (Deb
2
) with mean K values 1.20
±0.09 (Table 4). Gayanilo and Pauly (1997) reported that certain factors such as, sorting into classes, sex, stages
of maturity and state of the stomach often affect the well-being of a fish.
Table 4 Condition factor (CF) (Mean ±SD) of selected species
Fish species
Sites
Females(CF)
N
Males (CF)
N
Male +Female
V. beso
Deb
1
1.35±0.15
14
1.22±0.14
29
45
Deb
2
1.27±0.12
13
1.28±0.16
18
31
Deb
3
1.13±0.18
20
1.26±0.16
32
52
G. chebera
Deb
1
1.24±0.16
36
1.23±0.13
23
59
Deb
2
1.28±0.17
29
1.20±0.15
15
44
Deb
3
1.26±0.08
21
1.22±0.07
13
34
G. quadrimaculata
Deb
1
1.23±0.09
21
1.31±0.28
18
39
Deb
2
1.20±0.09
16
1.14±0.12
18
34
Deb
3
1.21±0.16
14
1.22±0.11
11
25
The condition factor of fish species showed the mean condition factor well above the average of 1.00. The K
value recorded in this study agrees with the values reported by Ayoade and Ikulala (2007). This is an indication
that the environmental conditions of the river are at optimum level, giving the fish a good condition for growth
and development (Wade, 1992). In general, high condition is associated with higher energy (fat) content,
increased food base, reproductive potential and more favorable environmental conditions (Paukert and Rogers,
2004). Therefore, the low K value of fishes were probably because of fluctuations in factors such as food quantity
and quality, water level, flow rate and water temperature.
y = 0.024x
2.614
R²= 0.920
0
5
10
15
20
25
0
2
4
6
8
10
12
14
Total weight(gm)
Total length(cm)


