International Journal of Aquaculture, 2017, Vol.7, No.20, 126-133
128
three (3) species at Deb
1
and Deb
2
sampling site with mean river width of 31 ± 3.37 m and 50.25 ± 4.27 m
respectively. This result is conformity with Toham and Teugels (1998) in Cameroon, EDDS (1993) in India and in
Ethiopia (Berie, 2007) in Beles and Gilgel Beles Rivers that a significant relationship exists between species
number and width of the river. In addition, canopy closure and diversity of substrate type (sand, gravel and large
rocks) were also most probable environmental gradient explaining the spatial distribution of species in the
sampling sites. In present study, in Deb
3
has thick vegetarian cover and diverse types of substratum than the others.
Thus, the presence of year round dense vegetation and higher catchment area, diversity of substrate, river depth
may favor the inhabitation of diverse groups of fish.
2.2 Length-weight relationship
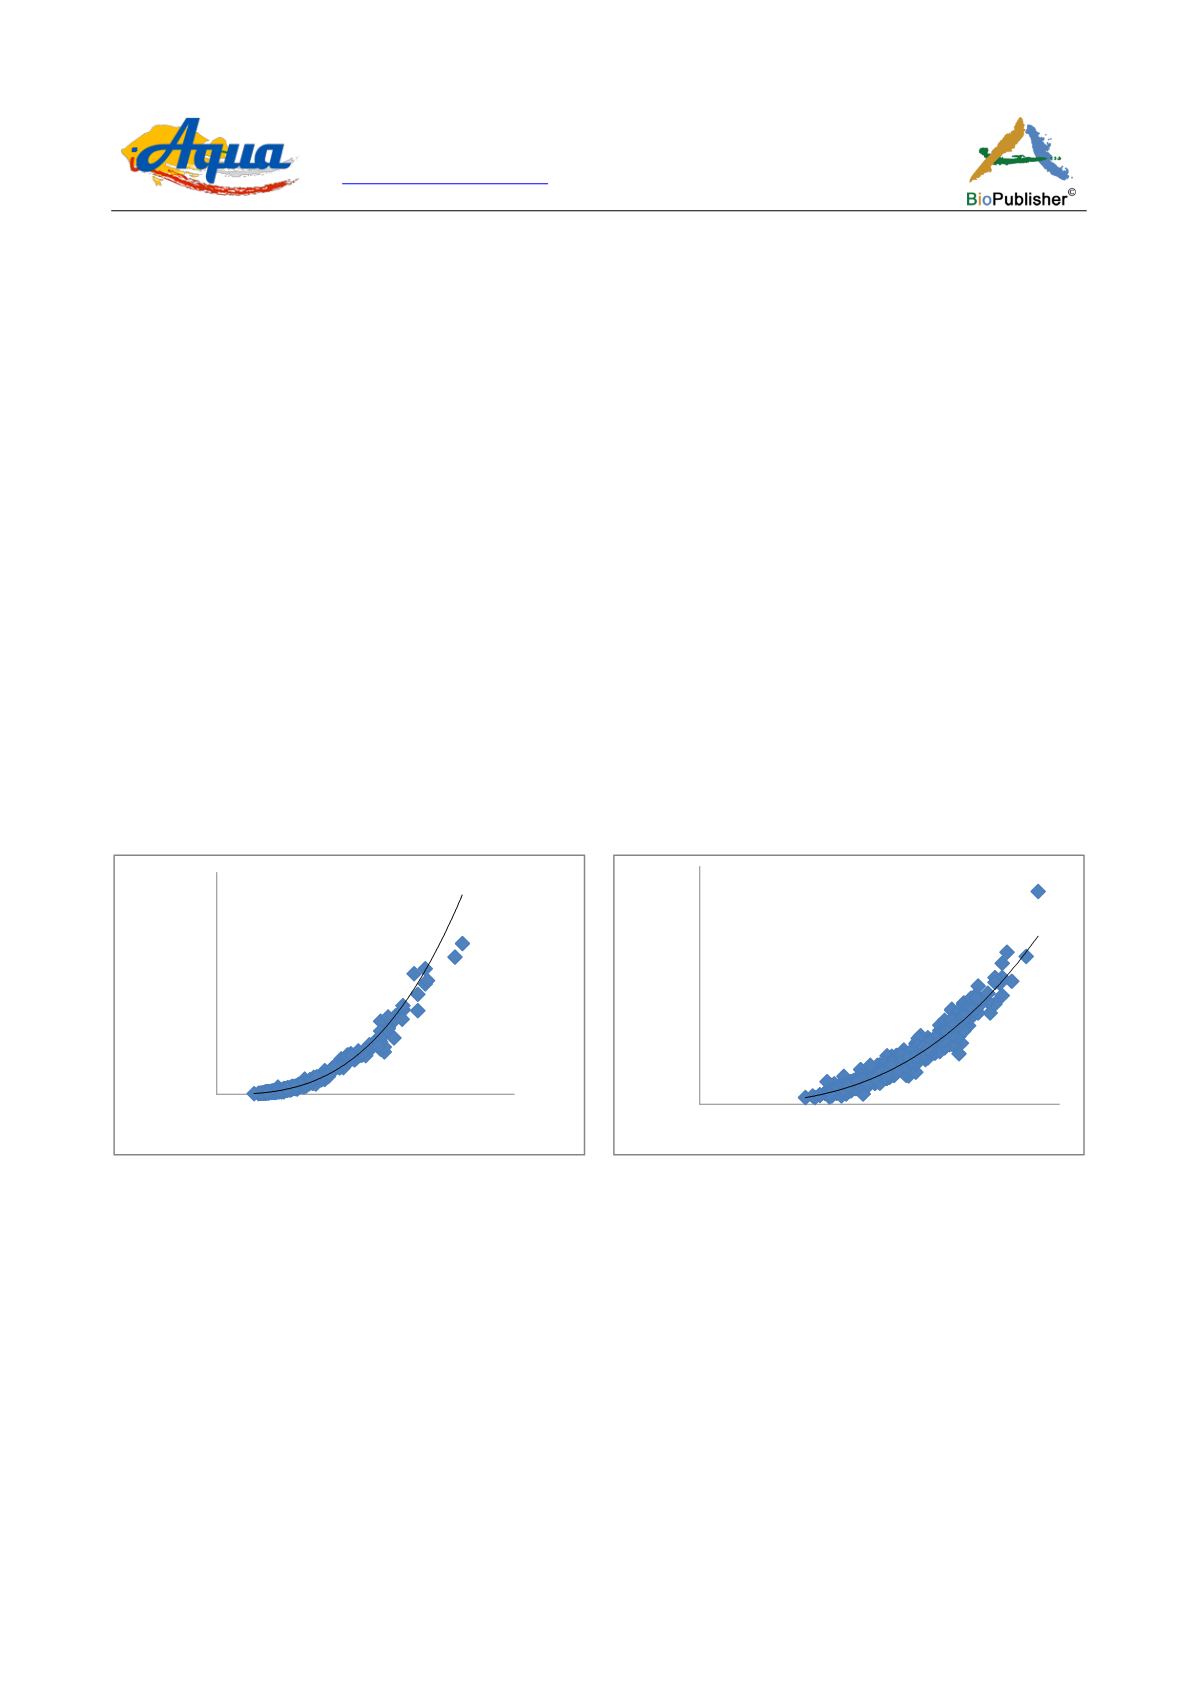
The relationship between total length and total weight of
V. beso
(0.98),
G. quadrimaculata
(0.92) and
G. chebera
(0.95) was curvilinear and highly since the r
2
varied between 0.92-0.98 (Figure 1) and positively correlated. This
indicates that weight of the fishes considered, increased with increase in length. This is in agreement with Fagade
and Olaniyan (1972), Fagade (1983), Layèyè(2006) and Ayoade and Ikulala (2007) on different fish species from
various water bodies.
The values for the length-weight relationship for
G. quadrimaculata
and
G. chebera
were respectively indicated
isometric (b=2.614, a=0.02) and (b=2.786, a=0.019) pattern implying that they tend to become thinner with
increasing length. But the values obtained for
V. beso
was (b=2.915, a=0.015) indicated weight increase with
length, The b value is nearer to 3 for the fish species selected where the slope ‘b’ may be varied due to stage of
sexual maturity, nutritional adequacy of the diet, and toxicology of the environment (Begenal and Tesch, 1978).
The results indicated strong positive correlation between the length and weight for V. beso (r
2
-0.9809),
G. chebera
(r
2
-0.9462), and
G. quadrimaculata
(r
2
-0.920) at different sites were shown in the (Figure 1; Figure 2; Figure 3).
Figure 1 Length-Weight relationship of
V. beso
Figure 2 Length-Weight relationship of
G. chebera
2.3 Condition factor
In the present study condition factor of
V. beso
,
G. chebera
and
G. quadrimaculata
were calculated both by sites
for species and separately for the sexes from all the collection sites. The highest values condition factor was
observed for
V. beso
and
G. chebera
from the site Deb
2
(Table 3). At this station the condition factor of
V.beso
varied between 0.86 and 2.72 and the mean value was (1.3105 ±0.23). The condition factor of
G. chebera
was
comparatively high at Deb
2
, ranged from 0.636 to 2.454 and the mean being 1.3249 ±0.24.
The mean condition factor of
G. quadrimaculata
at Deb
1
and Deb
2
did not vary considerably (1.22 ±0.21 and
1.20 ± 0.19 respectively), whereas the value at Deb
3
was the lowest (1.15 ± 0.18) Condition factor which
compares the well-being of a fish is based on the hypothesis that heavier fish of a given length are in better
condition (Bagenal and Tesch, 1978). According to Fagade (1979), condition factor decrease with increase in
length and also influences the reproductive cycle in fish (Welcome, 1979). The value obtained from the study
showed that all species studied were in good condition. The high value of condition factor was observed for
V.
beso
and
G. chebera
from the site Deb
2
.
y = 0.0151x
2.9151
R²= 0.9809
0
50
100
150
200
250
300
350
400
450
0
10
20
30
40
Total weight (gm)
Total length (cm)
y = 0.0199x
2.7869
R²= 0.9462
0
5
10
15
20
25
30
35
40
45
0
5
10
15
Total weight(gm)
Total length(cm)


