International Journal of Aquaculture, 2016, Vol.6, No.18, 1
-
6
3
crude fat / Wt of sample used) x 100). Energy (J/g) = (sample joules x 1) / sample wt. Ash (%) = (Wt. of ash / Wt.
of original sample) x 100.
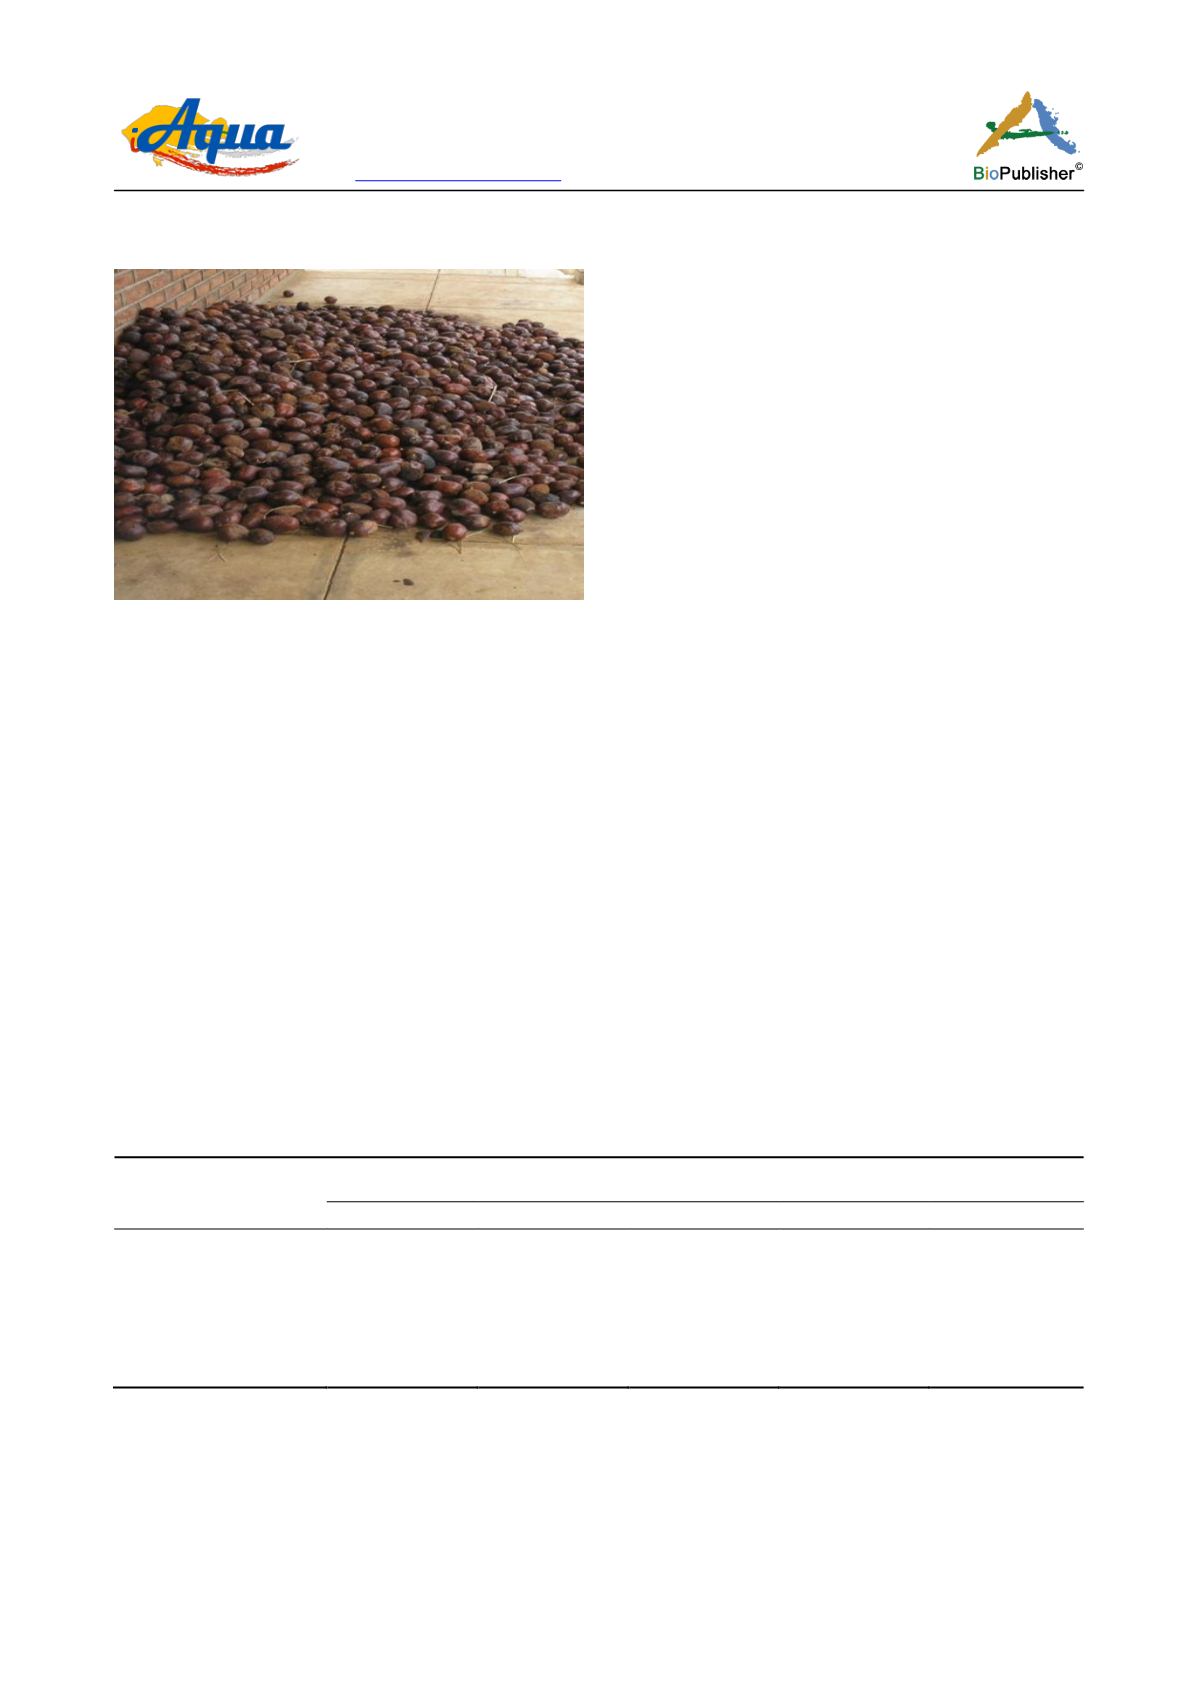
Figure 2 Dried Palm tree nuts used for smoking the
Rhamphochromis
fish fillets
2.4 Data Analysis
All statistical analyses were conducted using Microsoft Office Excel for Windows 2003. Treatment means were
compared using Analysis of Variance (ANOVA) at 5% level of significance in SPSS for Windows statistical
software version 15.0. Significant mean differences were separated using Duncans Multiple Range Test (DMRT)
and results reported in mean standard error (±SE).
3 Results and Discussion
Results for proximate composition (moisture, protein, fat, ash and energy) of the
Rhamphochromis
fresh fillets are
presented in Table 1. Highest and lowest moisture content was observed in fish that were salted then smoked
(28.99±0.02) and sundried then smoked (8.56±0.51) (P<0.05). Fish that were sundried and salted then smoked
exhibited the highest and lowest protein (53.68±0.79, 32.53±0.17) and energy I24.00±0.05, 16.31±0.02) levels
respectively (P<0.05). More fats were retained in sundried fish (27.25±0.02) while fish that were salted then
sundried had the lowest fat content (11.09±0.05) (P<0.05). Salted then sundried fish had more ash (18.83±0.12)
and lowest ash observed in fish that were smoked (5.03±0.03). A general observation was that fillets that were
sundried had better protein, fat and energy content while smoking of the product resulted into lowest levels of
these nutrients. On the other hand, salting increased ash levels in the fillets and a combination of sun drying and
smoking helped to produce a product with very little moisture content.
Table 1 Proximate composition of fresh
Rhamphochromis
fish fillets processed with different methods
Processing method
Nutrient
Moisture (%)
Protein (%)
Fat (%)
Ash (%)
Energy (kJ/g)
Unprocessed fillets
60.77±2.73
a
47.65±0.17
c
33.63±0.07
a
12.46±0.04
c
25.21±0.01
a
Sundried
10.45±0.82
e
53.68±0.79
a
27.25±0.02
b
5.54±0.61
e
24.00±0.05
b
Sundried smoked
8.56±0.51
f
51.40±0.04
b
17.83±0.03
d
6.59±0.03
d
22.76±0.05
c
Smoked
11.93±0.46
d
45.17±0.05
d
20.51±0.02
c
5.03±0.03
f
22.25±0.14
d
Salted sundried
24.47±0.16
c
34.99±0.12
e
11.09±0.05
ef
18.83±0.12
a
17.20±0.12
e
Salted smoked
28.99±0.02
b
32.53±0.17
f
11.52±0.03
ef
16.99±0.11
b
16.31±0.02
f
Means with the same superscript in a column are significantly not different (P>0.05)
Results agree with several earlier studies suggesting that processing alter nutrient content of food products (Eves
and Brown, 1993; Ahmed et al., 2011; Oparaku and Mgbenka, 2012; Makawa et al., 2014).


