International Journal of Aquaculture 2015, Vol.5, No. 35, 1-6
4
2001). Mean values of final fish weight, specific
growth rate and survival parameters were compared
using one-way analysis of variance (ANOVA).
Results and Discussion
Growth performance
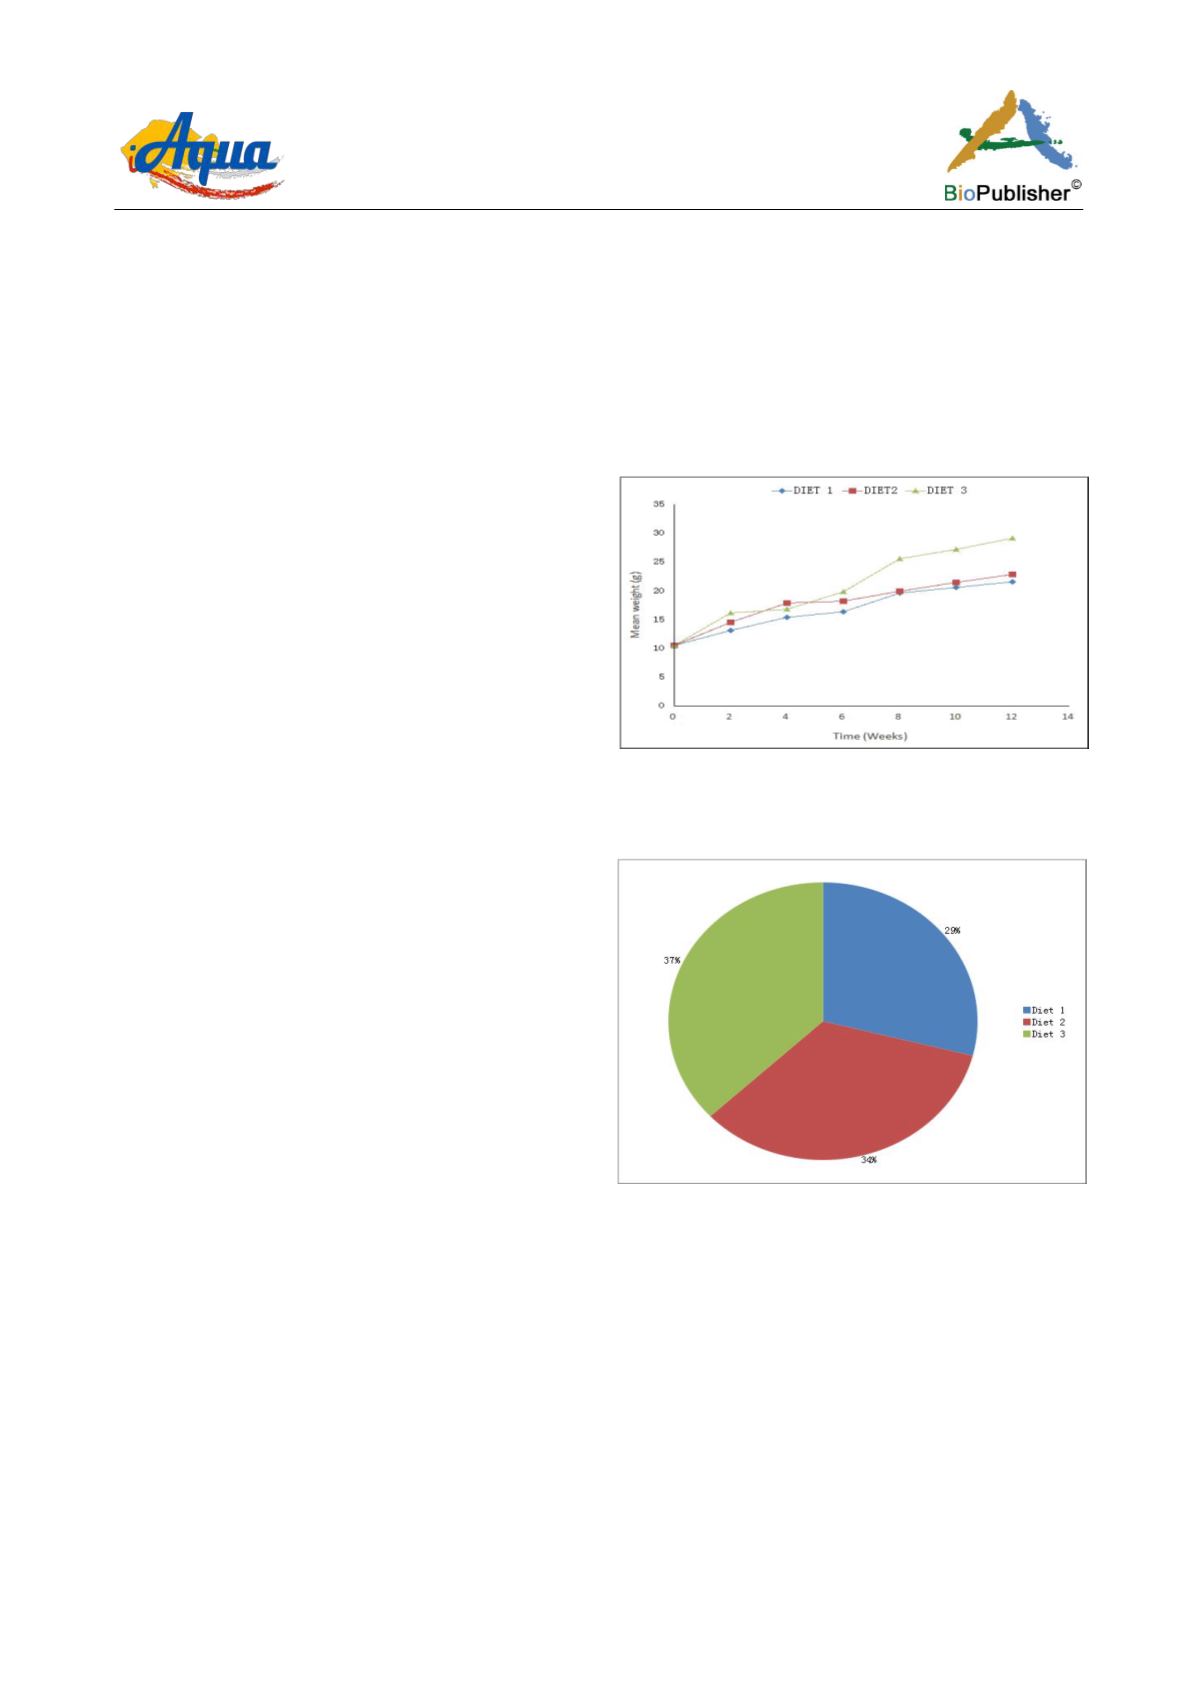
Figure 2 shows the weekly growth trend of the
experimental fish fed three treatment diets for twelve
(12) weeks. Although, growth of the fish continued to
improve over time, fish fed on Diet 1 did not show
remarkable improvement, despite being formulated
with 30% crude protein. The two treatments (Diets 1
and 2) fed on
Oreochromis niloticus
, however, yielded
less successful results, compared to Diet 3. Diet
cannot be ruled out completely as not giving good
results. Greater consumption of small pellets than
large ones could have influence on the growth size of
fish. Small pellet might have been relatively easier to
eat compared to large sized ones. In the present study,
there was minimum difference between Diets 2 and 1
at 30% CP. Omoregie and Ogbemudia (Omoregie and
Ogbemudia, 1993) reported that
Oreochromis
niloticus
requires percentage crude protein range of
30-35%, although an earlier study by Faturoti and
Akinbote (Faturoti and Akinbote, 1986), indicated that
Oreochromis niloticus
requires 28% for fry and
fingerlings respectively.
Overall, Figure 3 shows that Diet 3 recorded the
highest growth rate over twelve weeks experimental
period, while the least was from Diet 1.
The inability of fish fed on Diet 1 to catch up in body
weight with others may not wholly be known. Poor
performance of Diet 1 could therefore, be attributed
partly to particle size and quality of ingredients.
However, no significant growth performance
difference was observed on the fish fed Diets 1 and 2
(p> 0.05), whereas those fed on Diet 3, a significant
difference was noted at P<0.05. According to
Wolhfarth and Moav (Wolhfarth and Moav, 1993), a
significant relation existed between the initial weights
and growth parameters of most fish. Figure 4 shows
the mean standard length of fish under
experimentation. However, Diet 1 has demonstrated
that once it was improved upon it could perform
better.
The trend was the same with mean standard lengths of
the fish. The average total body length was 90.2 cm
for fish fed Diet 1, 106.1 cm for Diet 2 and 114.8cm
for Diet 3. Based on this, it was quiet clear that Diet 3
performed far much better than the other two.
Mean weight gain and survival rate
The growth performance of the fish in terms of mean
weight gain, percentage weight gain (PWG), specific
growth rate (SGR), Feed conversion ratio (FCR) and
survival rate is presented in Table 1.
Figure 2: Growth in rate of
Oreochromis niloticus
raised in
hapas over 12 weeks
Figure 3: Percentage growth of fish under experimentation for
twelve (12) weeks
The best growth was recorded for groups of fish fed
on Diet 3. Final mean body weight ranged between
21.6g, Diet 1, 22.9g in Diet 2 and 29.2g in Diet 3,
which was by far the highest. Feeding the fish with
Diet 3 resulted in significantly higher mean fish
weight than that of fish fed on Diet 2 and 1. Similarly,
highest mean weight gain (MWG) and percent weight
gain (PWG) were recorded in fish fed Diet 3. This
result was in agreement with the findings of
Kestemont (Kestemont, 1995), who reported that in
aquaculture; initial stocking size is an important factor


