International Journal of Aquaculture 2015, Vol.5, No. 35, 1-6
5
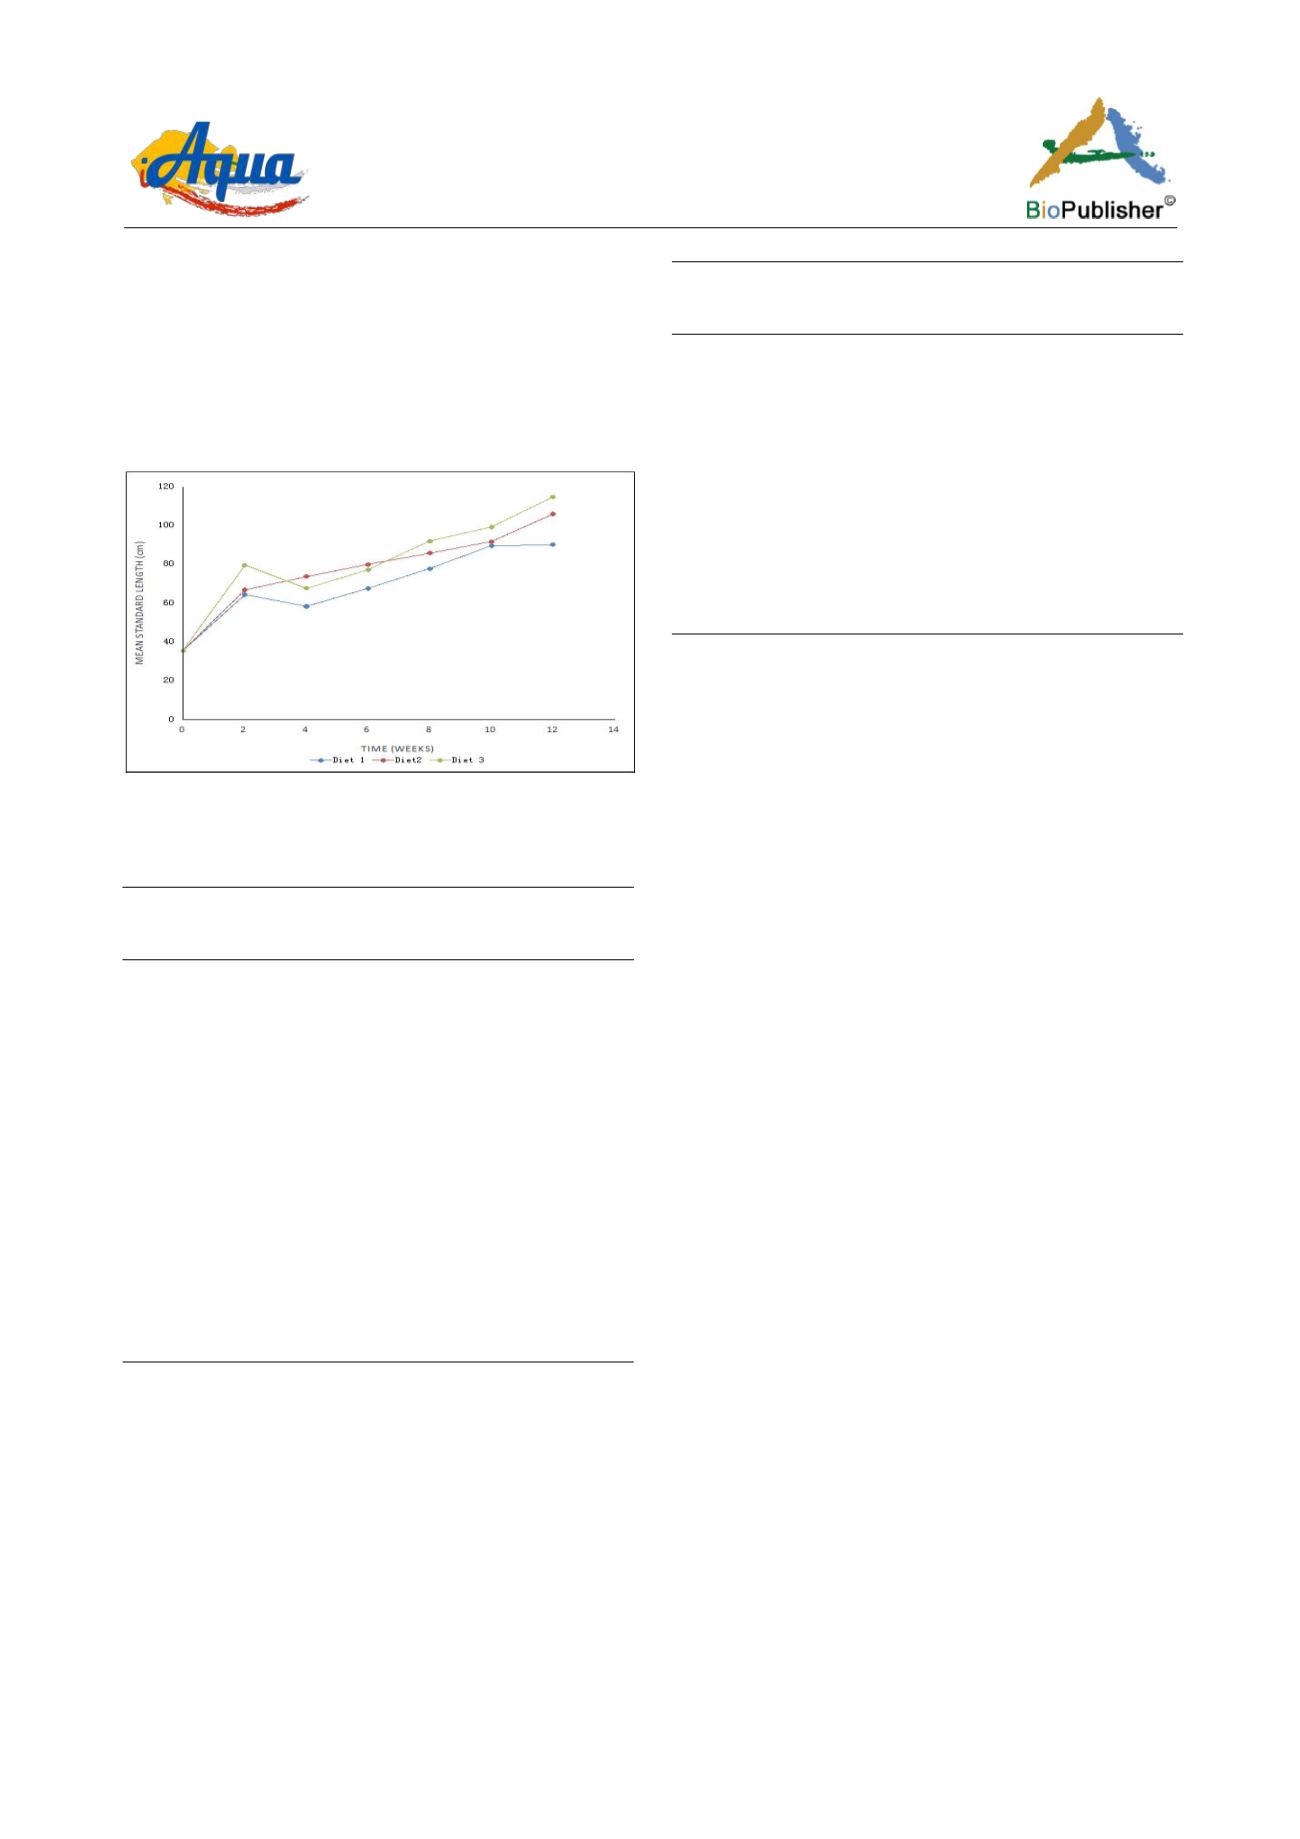
affecting the culture period, feed conversion, and final
weight. In general survival rate of the fish in all
treatments was excellent. Fish fed on Diet 3
performed very well with 93%, while those fed on
Diet 1, recorded a slightly higher mortality rate and
reasons for that were unknown, despite most of the
other factors being normal.
Figure 4: Mean standard length of fish under experimentation
for twelve weeks
Table 1: Fish growth over a period of twelve week
Parameter
Nardc Farm
Feed
Treatments
Namfeed
Tiger Animal
Feed
Initial mean
weight(g/fish)
10.5± 0.38 10.5±0.38
10.5±0.38
Final mean
weight(g/fish)
21.6
22.9
29.2
Weight gain
(g/fish)
11.1
12.4
18.7
Weight gain/day 0.13
0.15
0.22
Weight gain (%) 105.71
122.86
178.1
SGR (%/day)
2.6
2.8
3.8
FCR
3.3
2.1
2
Survival rate
78
87
93
Water quality parameters
Table 2 shows weekly water quality parameters.
Results obtained show that means values of water
quality parameters over twelve (12) weeks
experimental period, were within the acceptable range
for freshwater fish according to Abd El- Hakim (Abd
El- Hakim et al., 2002) and Abd El-Hamid (Abd
El-Hamid, 2003). In the three hapas treatments
dissolved oxygen (mg/L) ranged between 3.66 mg/l
and 7.29 mg/L. Kamal (Kamal et al., 2004) reported
Table 2: shows weekly water quality parameters
Weeks
pH
Temperature
(
o
C)
DO
(mg/l)
0
6.97
23.9
5.01
2
7.47
24.8
6.3
4
7.56
25.3
3.73
6
7.44
24.3
4.39
8
7.58
25.5
6.8
10
7.64
25.9
7.25
12
7.43
26.1
6.51
Means
7.44
25.11
5.71
that levels of dissolved oxygen above 4 ppm is
considered a limiting value, below which, fish may
live but cannot feed or grow well. Meanwhile, the
average pH values for the treatments ranged from 7.18
to 7.60.
Conclusion
It could be concluded that the growth performance and
survival rate of
Oreochromis niloticus
fed with 30%
crude protein, was observed to be higher in fish feed
on Diet 3, which showed significantly difference of
(p<0.05) compared to Diets 2 and 1. However, there
was no significant growth difference (p>0.05)
between Diet 2 and 1 In the same vein fish fed on Diet
3 had high survival rate compared to those fed on
Diets 1 and 2. Diet 1 performed very poorly in
comparison with the two commercial feeds. However,
Diet 1 can be improved upon significantly to become
cost effective and nutritionally through further
research.
References
Abd El-Hakim, N. F., Bakeer, M. N. and Soltan, M. A., 2002, Water
Environment for Fish Culture, Deposition No.: 4774, ISBN:
977-298-228-5
Abdel Hamid, A. M., 2003, Scientific Fundamentals for Fish Production and
Management, 2nd Rev. Ed., Deposit No. 15733/2003, Mansoura Univ
Barnabe, G., 1994, On growing fish in intensive systems, pp 349-370, In: G.
Barnabe (editor), Aquaculture Biology and Ecology of Cultured
Species, New York: Ellis Horwood. 403p
Barrows, F.T., and Hardy, R.W., 2001, Nutrition and Feeding, pp 482-558,
In: G. Wedemeyer (editor), Fish Hatchery Management, 2nd edition
Bethesda,Maryland: American Fisheries Society. 733p
Begum M., Pal, H.K., Islam, M.A., and Alam, M.J., 2008, Formulation of
quality fish feed from indigenous raw materials and their effect on the
growth and maturation of Mystus gulio, Bangladesh Fisheries Research
institute, Khulna-9280
Boyd, E.C., 2004, Farm-Level Issues in Aquaculture Certification: Tilapia.


