Basic HTML Version


International Journal of Aquaculture, 2014, Vol.4, No.09 55
-
63
http://ija.sophiapublisher.com
59
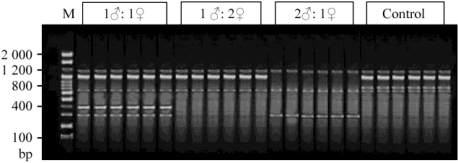
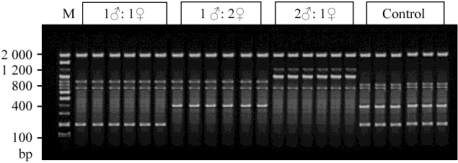
Figure 1 Randomly amplified polymorphic DNA (RAPD)
profile of
Macrobrachium rosenbergii
post larvae for the
primer OPA
1
. M is molecular weight marker (DNA Ladder)
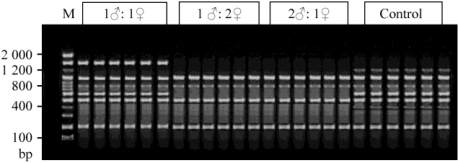
Figure 2 RAPD profile of
Macrobrachium rosenbergii
post
larvae for the primer OPA
3
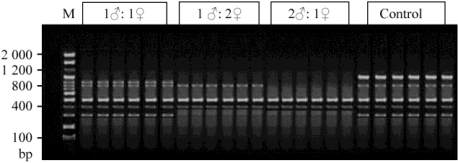
Figure 3 RAPD profiles of
M
.
rosenbergii
post larvae for the
primer OPA
4
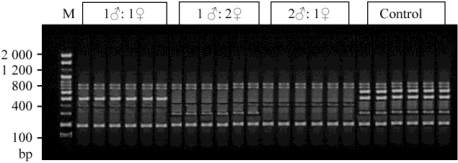
Figure 4 RAPD profiles of
M
.
rosenbergii
post larvae for the
primer OPA
9
Figure 5 RAPD profiles of
M
.
rosenbergii
post larvae for the
primer OPA
10
Table 2 represents the total number of bands, number
of polymorphic bands and overall polymorphism
proportion obtained from five different primers at
different size ranges. Intra-population (within the
experimental groups) genetic similarity index (SI)
values for 1♂: 1♀, 1♂: 2♀, 2♂: 1♀ and control were
found to be 94.1%, 96.2%, 96.8% and 93.7%
respectively. Inter-population SI (S
ij
) values for 1♂:
1♀ vs. 1♂: 2♀, 1♂: 1♀ vs. Control, 1♂: 1♀ vs. 2♂:
1♀, 1♂: 2♀ vs. Control, 2♂: 1♀ vs. Control and 1♂:
2♀ vs. 2♂: 1♀ were 91.4%, 94.7%, 92.1%, 92.5%,
91.8% and 95.6% respectively.
OPA
10
generated the highest number (9) of polymorphic
bands where as OPA
1
and OPA
3
produced the lowest
number (6 for each) of polymorphic bands. Table 3
summarizes the data for all primers and
experimental groups.
The highest proportion (52%) of polymorphic bands
was obtained for the post larvae (PL) produced from
the natural broods (control) and the lowest (24%) was
obtained for the PL produced from 2♂: 1♀ sex ratio.
Polymorphic band percentage of 1♂: 1♀ sex ratio
(48%) was very close to that of control and
comparatively lower for the sex ratio 1♂: 2♀. Overall
gene diversity for all the experimental groups was
found to be 0.10. The highest gene diversity value
(0.10) was obtained for the control population and the
lowest value (0.05) for 2♂: 1♀. Gene diversity values
showed significant difference at 95% confidence
interval.
The highest and lowest F
ST
values were obtained for
2♂: 1♀ vs. Control and 1♂: 1♀ vs. Control
combinations respectively (Table 4). The highest and
the lowest genetic distances (Nei’s genetic distance)
were obtained at 0.012 for 1♂: 1♀ vs. 2♂: 1♀ and 2♂:
1♀ vs. Control combinations and 0.007 for 1♂: 1♀ vs.
Control combination (Table 4). Unweighted pair
group method of arithmetic mean (UPGMA)
dendrogram revealed the differentiation of the
experimental groups into 2 separate clusters depending
on Nei’s (1973) distance values (Figure 6).
3 Discussion
The results of the present study clearly indicate that
healthy brood stock for successful breeding of giant
freshwater prawn can be developed within the closed
condition or in the ponds. The maturity and breeding
cycles of
M. rosenbergii
stocked in the pond environment
were similar to those of nature and similar finding was