Triticeae Genomics and Genetics 2015, Vol.6, No.2, 1-7
4
diversity among the given varieties with a protein
weight marker of 14.3 kDa to 97.4 kDa. Variability of
total seed storage proteins was investigated by using
SDS-PAGE (Laemmli, 1970).
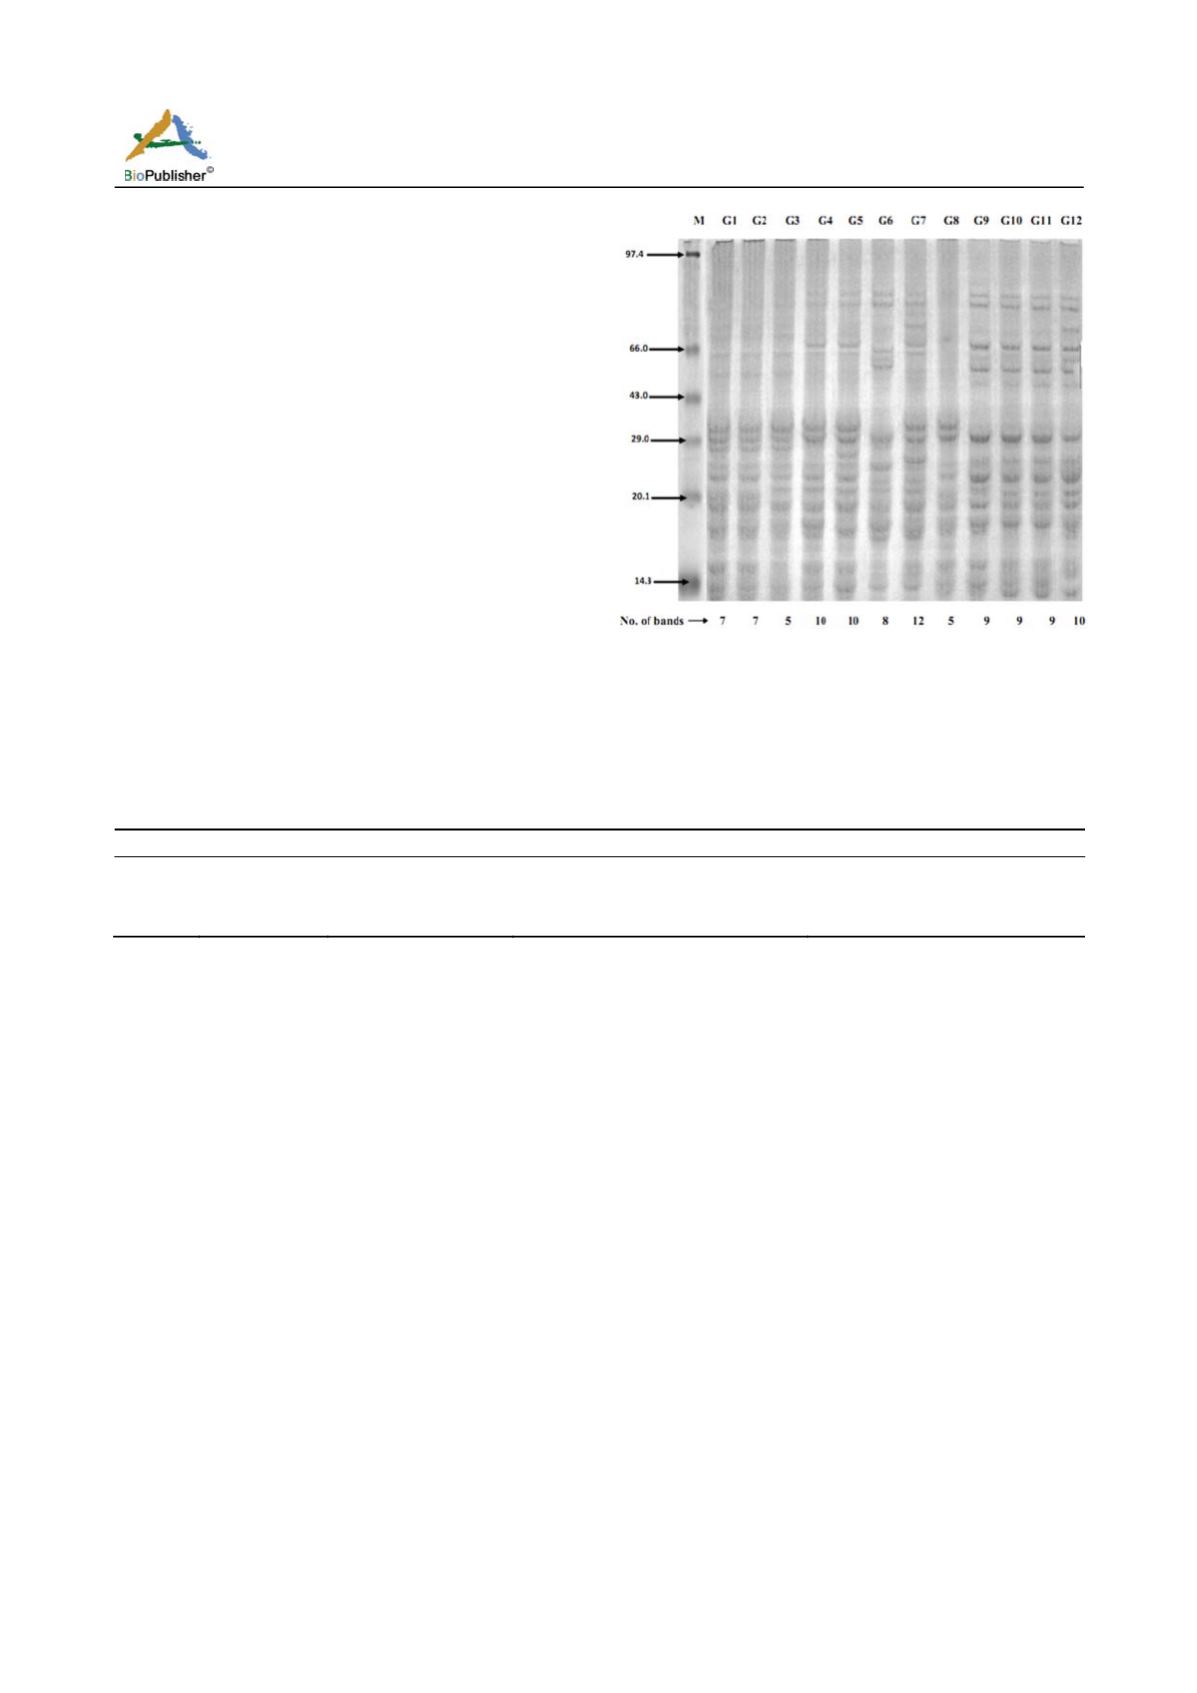
The results revealed a total of 117 and 101
electrophoretic bands on 10% and 15% gel (Figure 1)
respectively. The size of polypeptides resolved ranged
from 14.5 to 81.0 kd on 10% gel and 14.3 to 75 kd on
15% gel. For the analysis of banding pattern on the
gels they were recorded as present or absent. For
analysis each band was assigned a value of “1” for
presence and “0” for absence.
One band (49.0 kd) was monomorphic for all
genotypes on 10% gel. On 15% gel also one band
was monomorphic (29 kd). Fifteen scorable bands
were resolved on 10% gel in which 14 were
polymorphic (93.33%). Similarly 13 scorable bands
were resolved on 15% gel in which 12 were
polymorphic (92.30%) (Table 2).
Figure 1 Protein Profile of Soluble Protein on SDS-PAGE (15%)
Note: G1: MP-4010; G2: HI-8713; G3: C-306; G4: LOK-1; G5:
Raj – 4037; G6: HD- 2932; G7: KH-65; G8: KRL-19; G9:
KRL-213; G10 - KRL 210; G11 - KRL-1-4; G12 - Raj-3765; M:
Protein molecular weight marker (14.3 to 97.4 kDa)
Table 2 Polymorphism information of protein bands analyzed on SDS-PAGE
S. No.
Gel con. (%)
Scorable bands (a)
Total No. of polymorphic bands (b)
Polymorphism (%) b/a ×100
1
10
15
14
93.33
2
15
13
12
92.30
Total
28
26
92.85
The diversity in seed storage proteins has also been
reported by Khan et al. for wheat varieties (Khan et al.,
2002). Moreover, identification of three wheat
genotypes including ILC-195, CM-2000 and
CM-98/99 has also been reported by protein markers
(Zeb et al., 2006). The genetic diversity estimates
based on seed storage protein were low since the
genotypes studied for high quality seed proteins;
however this helps to classify varieties in different
groups (Fufa et al., 2005).
Electrophoresis of proteins is a powerful tool for
identification of genetic diversity and the SDS-PAGE
is predominantly considered as a consistent
technology because seed storage proteins are highly
independent of environmental fluctuations (Javid et al.,
2004; Iqbal et al., 2005). Seed protein patterns can
also be used as a promising tool for distinguishing
cultivars of particular crop species (Jha and Ohri,
1996; Seferoglua et al., 2006). However, only a few
studies indicated that cultivar identification was not
possible with the SDS-PAGE method (De Vries, 1996).
The SDSPAGE is considered to be a sensible and
reliable technique for species identification (Gepts,
1989).
2.1 Genetic relationship among the genotypes and
cluster analysis
Protein profile obtained on SDS-PAGE with 10% and
15% gel was used to find genetic relationship among
the genotypes. Results are illustrated in Table 3. The
size of polypeptides resolved ranged from 14.3 to 81
kd. There is no unique band found in both gel. The
polypeptides having molecular weight 49 kd & 29 kd
are appeared in all genotypes in 10% and 15% gel
respectively. A band of 71 kd is appeared only in G7
and G12 and absent in other genotypes. Polypeptide
and 64 kd also absent in all genotypes except in G6
and G7 in 10%.
In 15% gel, the size of polypeptides resolved ranged
from 14.3 to 75 kd. The polypeptide having molecular
weight 66 kd is only appeared in G11 and G12. A
band of 20.1 kd was appeared in all genotypes except
in G1 and G2.


