Rice Genomics and Genetics 2015, Vol.6, No.2, 1-5
4
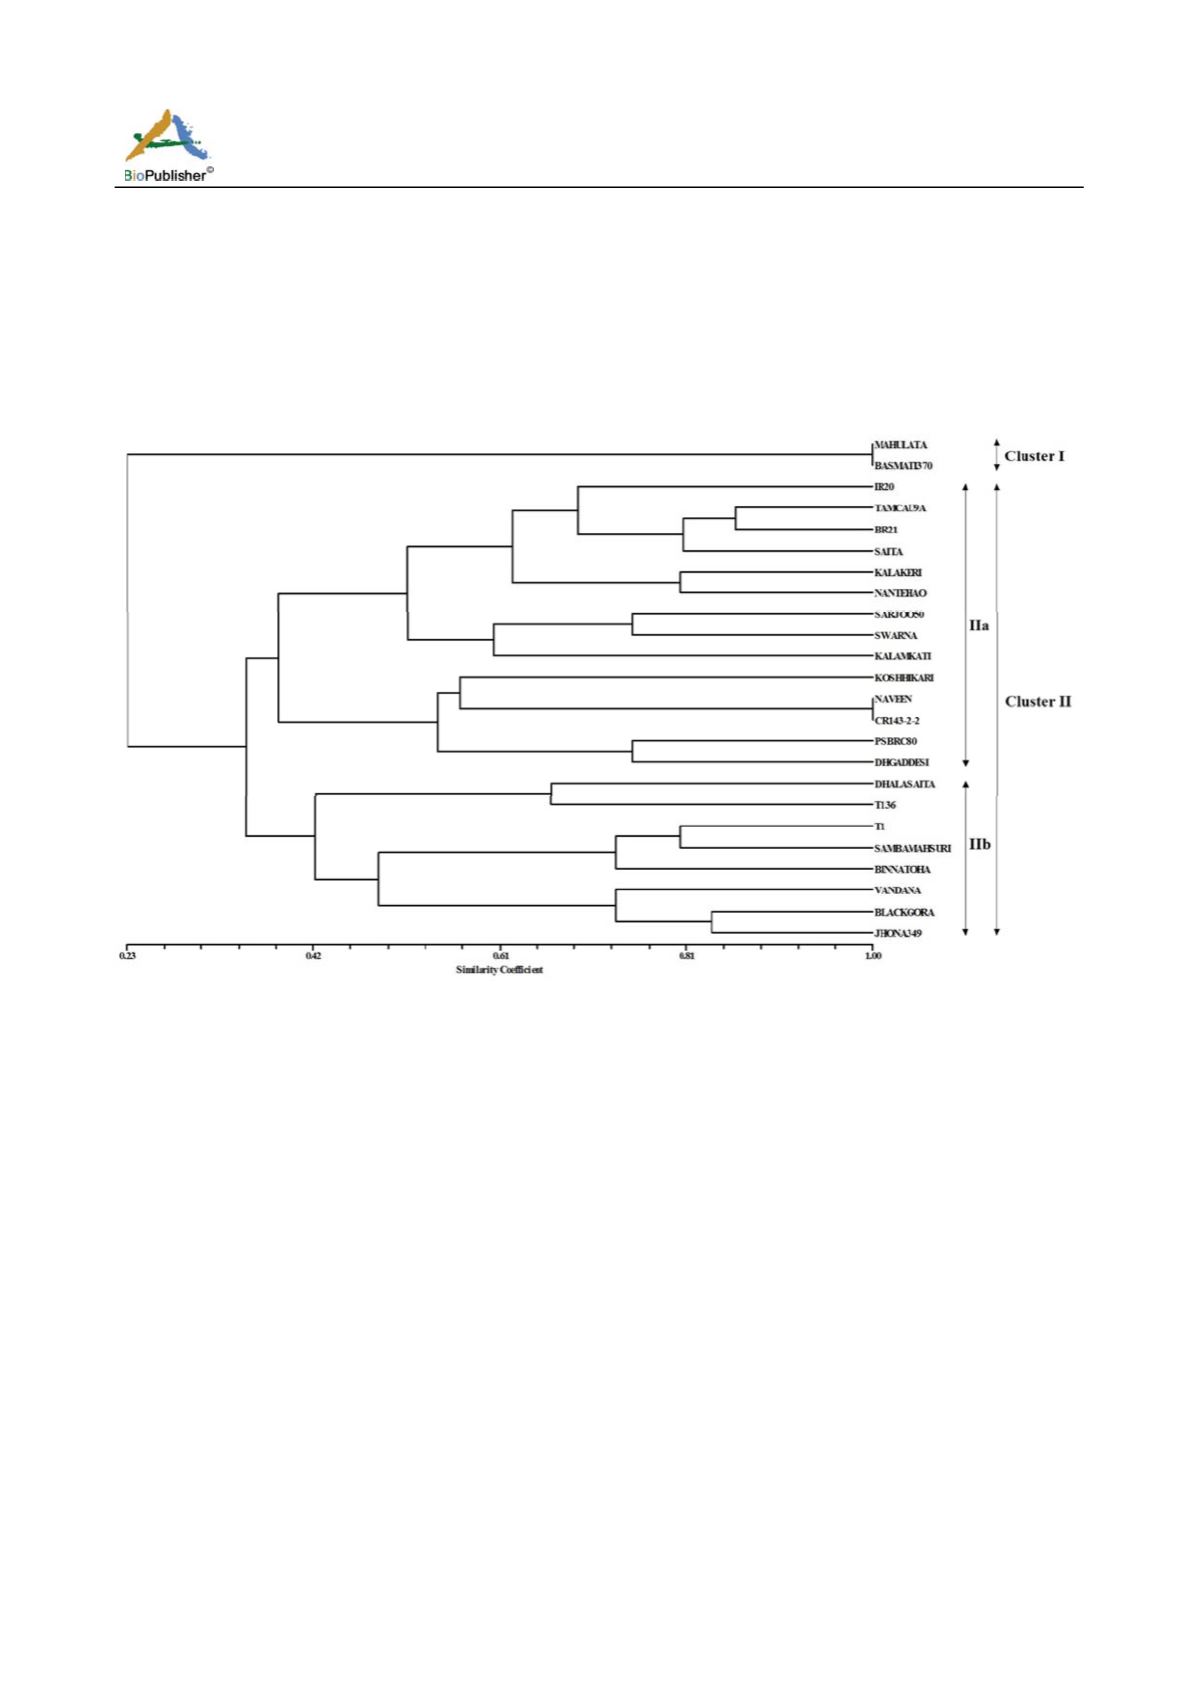
The UPGMA dendrogram based on dice similarity
coefficient grouped the 24 individuals into two major
clusters with similarity of 23% (Figure 3). Cluster II
was the major cluster with 22 genotypes, whereas
Cluster I contained only two genotypes i.e. Basmati
370 and Mahulata. Further, Cluster II was divided
into two sub clusters (IIa and IIb) at 38% similarity
level. Sub-cluster IIa contained 14 genotypes with
low genetic similarity and high degree of
heterogeneity, while, eight genotypes were grouped
together in sub-cluster IIb. A 100% genetic similarity
based on protein banding pattern was observed
between genotypes Basmati 370 and Mahulata;
Naveen and CR 143-2-2.
Figure 3 UPGMA dendrogram illustrating genetic relationship among 24 rice accessions
3 Discussion
Drought, being the most devastating abiotic stress for
rice production, especially in the rainfed ecosystem,
seed protein profiling could be useful towards varietal
identification. Further, seed proteins have potential
role towards early vigour and seed dormancy trait
which are the important factors in drought tolerant
genotypes (Ruan et al., 2002; Mathew and
Mohanasarida, 2005).
In the present investigation, we could differentiate
amongst 24 drought tolerant rice genotypes based on
their seed proteins banding pattern. A total of 90
polypeptide bands were harvested from these
genotypes, which is higher than the earlier report of
Habib et al. (2000) who could detect a total of 32
bands from 15 rice genotypes. In our study, one
genotype, Jhona 349 was detected with 7 bands
(highest), which is comparatively low than the earlier
reports of Sharief et al. (2005), who could identify 17
bands in a rice cultivar Giza 177, revealing significant
variation for seed protein in different rice genotypes.
Moreover, the gel percentage and/or size could be
playing critical role for the variation in number of
polypeptide sub-units reported in different studies. We
could detect a comparatively lower average genetic
distance (0.294) among the tested genotypes, which
might due to the close genetic background among
these genotypes (Javaid et al., 2004). According to
UPGMA dendrogram, a 100% genetic similarity of
protein profiling were detected between Basmati 370
and Mahulata, Naveen and CR143-2-2, revealing
close association for seed proteins among these pairs.
Electrophoretic analysis of the seed proteins had direct
relationship to the genetic background of the proteins
which could be used as a potential marker for genetic
diversity study and varietal identification (Thanh and
Hirata, 2002, Javid et al., 2004, Iqbal et al., 2005,


