Rice Genomics and Genetics 2015, Vol.6, No.2, 1-5
3
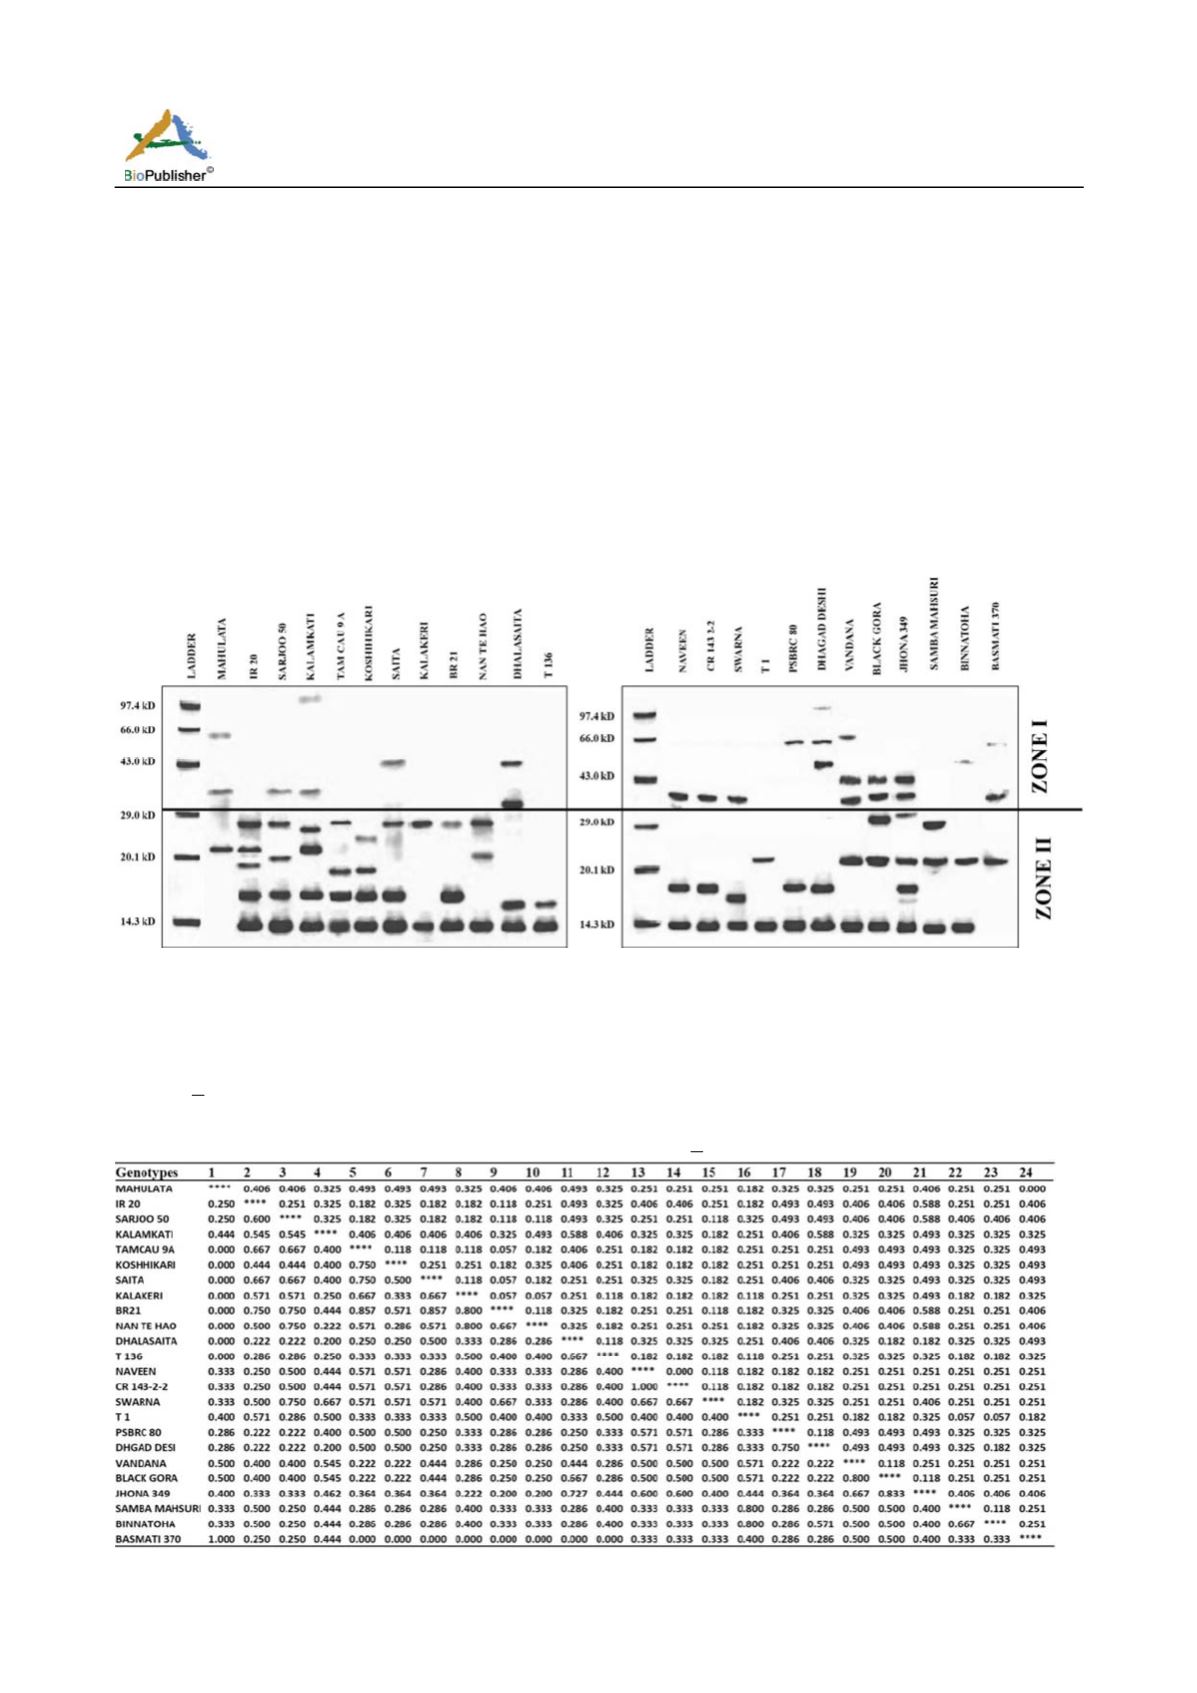
the banding pattern was observed to be high in Zone I
with an average of 2.6 bands as compared to Zone II,
where the average number of band was 1.2. The
number of bands in Zone I ranged between 1 (Sarjoo 50,
Saita, Naveen, CR 143-2-2, Swarna and Binnatoha) and
3 (Vandana, Black gora and Jhona 349) per individual.
Similarly, the number of protein bands per sample
varied from 1 in Mahulata and Basmati 370 to 5 in IR
20. On the other hand, based on intensity of individual
protein bands the banding profile was categorized into
three groups i.e. Group I [low intense bands (Example:
97.4 kda in Kalamkati, 37.8 kda in Sarjoo 50, 24 kda in
Koshikari etc.)], Group II [moderate intense bands
(Example: 37.8 kda in Naveen, 23.7 kda in T1, 45 kda
in Dhalasaita etc.)] and Group III [high intense bands
(Example: 34 kda in Black gora, 16.2 kda in
Dhalasaita etc.)]. The number of intense bands varied
between groups with 10, 38 and 42 in Group I, II and
III respectively. All the three categories (low,
moderate and high intense) of bands were observed in
the genotypes like Sarjoo 50, Kalamkati, Koshikari,
Dhagaddesi, Jhona 349 and Binnatoha. However,
banding profile revealed that, all the genotypes varies
from each other either for total number or molecular
weight or intensity of protein bands except the
genotypes Naveen and CR 143-2-2.
Figure 1 Gel illustrating seed protein banding profile of 24 rice accessions
The pair wise genetic similarity between the tested
individuals ranged from zero to one with an average
of 0.398+0.190 (Figure 2). However, the pairwise
Nei’s genetic distance ranged from 0.000 (lowest) for
genotype pair of basmati 370 - Mahulata and Naveen -
CR 143-2-2 to 0.588 (highest) for genotype pair
Dhalasita – Kalamkati, Dhgad desi – Kalamkati,
Jhona 349 – IR 20, Jhona 349 – Sarjoo, Jhona 349 –
BR 21 and Jhona 349 – Nan Te Hao with an average
of 0.294+0.121 (
data not shown
).
Figure 2 Genetic similarity of the 24 rice genotypes based on their seed protein profile


