Basic HTML Version


Plant Gene and Trait 2012, Vol.3, No.8, 43
-
49
http://pgt.sophiapublisher.com
45
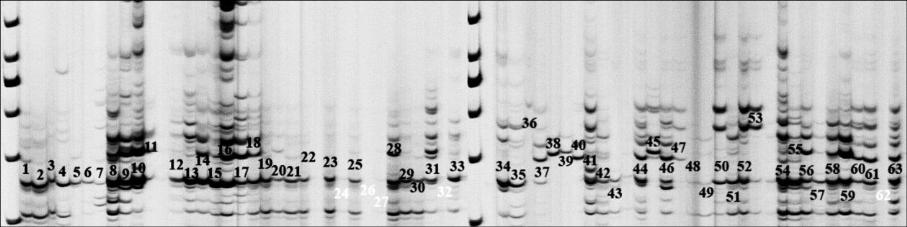
Figure 1 The high level of polymorphism resolved on 5% Polyacrylamide gel and Amplified DNA fragment generated by Cyp52
primers fluorescently visualized in GS2000
Note: The numbers represent the sample codes in table 4
highest value (r = 0.74) was observed for UPGMA
clustering method based on Simple Mathing’s similarity
coefficient (Table 2). Therefore, the dendrogram was
constructed based on this method was used for
depicting genetic diversity of genotypes (Figure 2).
Cluster analysis divided the 63 individuals into four
groups. Group 1 contains two individuals as Pirdal
1 and 2 in Gilan province which was placed in a
separated cluster with a very low similarity to other
groups. Group 3 contains eleven individuals in two
provinces Gilan and Fars including Poshtehan, Posh-
tehan shahed 1, 2, 4 and Tange kherghe 1, 3, 4, 5, 6
and Tange kherghe shahed 1, 2. Also group 4 contains
two individuals as Tange soulak 3 and Sirch 1 in
Kohgiloyeh and Kerman province, respectively. All
other 48 individuals placed in group 2 belonged to 13
provinces in Iran.
Principal coordinate analysis (PCo) based on genetic
similarity metrics was used to visualize the genetic
relationship among individuals. The first two eigen-
vectors accounted for 51.87% of the total molecular
variation. Therefore, PCo results confirmed the results
of cluster analysis (Figure 3) except that Pirdal 1 at
group 1 which is mixed to group 3 and also Sirach1 at
group 4 which is mixed to group 2. The genetic
distances among studied individuals were represented
in Table 3. The highest genetic distance was recorded
between Pirdal 2 in Gilan and Dorbid 1 in Yazd and
lowest one between Dehbakri 1 and 2 in Kerman
province. The individuals with the lowest genetic
distance with Dehbakri 1 (Kerman P.) as a most dia-
meter tree were Dehbakri 2 (Kerman P.) and Chevar 1
(Ilam P.) and the closest to Abarkooh as the most
famous tree were Lar (Kohgilooyeh & Boi. P.) and
Kashmar (Khorasan Razavi P.) as well.
2 Discussion & Conclution
Most conifers have high levels of genetic diversity
and low levels of differentiation among populations,
as measured by allozymes (Hamrick et al., 1992).
However, due to the complex effects of historical
factors such as speciation process and Quaternary
glaciation, it is difficult to make a priority prediction
of the levels of genetic diversity in endangered species
(Maki, 2003).
The results of this project represent the first large-
scale analysis with nuclear molecular markers to
assess genetic diversity of long-lived
Cupressus
sempervirens
trees throughout Iran. The 8 loci anal-
yzed differed greatly in variability level, from loci
with few variants for allele to others with abundant
polymorphism for alleles widely different in size. All
8 loci were polymorphic, having a total of 113 alleles
among the 63 individuals. Previous study conducted
on natural stands of Cypress in north of Iran based on
the same primers was carried out on 60 different
Table 2 Comparison of different methods for constructing dendrogram
Cophenetic coefficient (r)
Simple Maching
Dice (Nie & li)
Jaccard
UPGMA
r = 0.737 48 *
r = 0.685 92
r = 0.724 84
Complete Linkage
r = 0.643 03
r = 0.542 49
r = 0.594 16
Single Linkage
r = 0.702 86
r = 0.558 74
r = 0.599 05