International Journal of Mol. Ecol. and Conserv. 2015, Vol.5, No. 2, 1-6
3
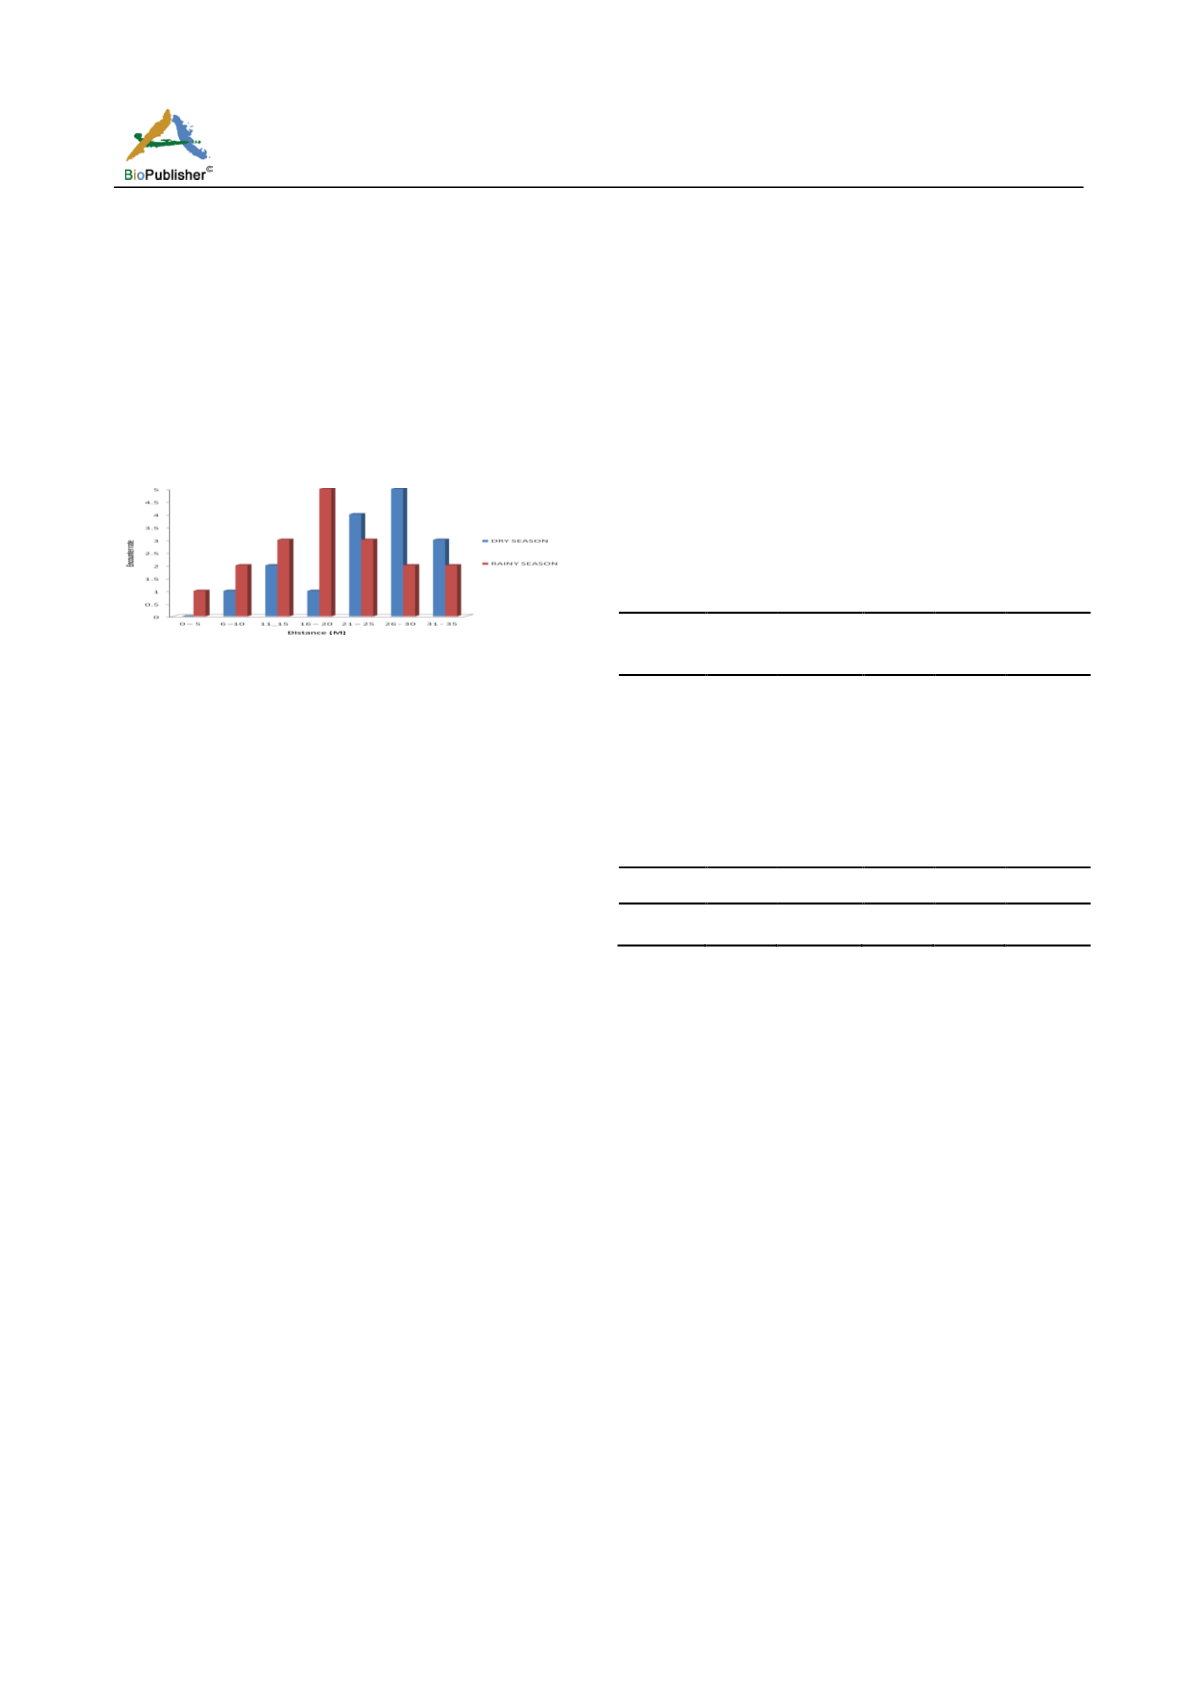
the line transect. A greater proportion of the encounter
made in the dry season was within 21m and 35m
sighting distance of the transect line. The result of the
rainy season encounter showed that there was an
encounter with
Cercopithecus sclateri
within the 5m
transect line which was not observed in the dry season
census. Majority of the rainy season encounter was
observed between the 11m and 25m width of the
transect line.
Figure 1 Seasonal variation in distance of encounter rate of
Sclater’s guenon in Ikot Uso Akpan
Seasonal variation in census data
The result shown in Table 1 indicates the difference
between the various parameters measured during the
census of Sclater’s guenon in the study area. The
result shows there was difference between all the
parameters measured during the dry and rainy season.
A total of 62 adult Sclater’s guenon was observed in
the dry season which was less than the observation of
65 adults in the rainy season with a mean of 63.5
adult/season and 4.23 adult/transect. The juvenile
population encountered in the area was 19 and 21 in
the dry and rainy season respectively. The juvenile
encounter had a mean of 20/season and 1.33
encounter/transect surveyed.
Furthermore, the indivdual count of
Cercopithecus
sclateri
for the dry season was less than the rainy
season encounteer of 86 individual. The mean of
individual count/season was 83.5 with a mean
individaul encounter/transect of 5.56 individuals. The
group count of
Cercopithecus sclateri
was 16 for the
dry season and 18 for the rainy season. Both season
had a mean count of 17 group and a mean of 1.13
group/transect surveyed in the study area. It took a
total of 415m perpendicular distance in the dry season
to make a total of 81 individual count and 16 group
count in the study area and a total of 275m
perpendicular distance in the rainy season to make a
total of 86 individual count and 18 group count in the
study area. The mean seasonal perpendicual was 345m
to a total of 83.5 individual count and 17 individual
count while the mean perpendicular distence per
transect surveyed was 23m to make a total of 5.56
individual and 1.13 group survey in Ikot Uso Akpan
community forest.
However, an analysis of the differences between all
the parameters measured across the two season (Table
1) showed no significant difference (
p
> 0.05) except
for the differences in the sighting distances between
the dry and rainy season which was observed to be
significantly different (
p
< 0.05).
Table 1 Seasonal survey differences of Sclater’s guenon in Ikot
Uso Akpan community forest
Variables
Adult
Juvenile Indivi-
dual
count
Group
count
Distance
(m)
Dry
62
19
81
16
415
Rainy
65
21
86
18
275
Total
127
40
167
34
690
Mean/
Season
63.5
20
83.5
17
345
Mean/
Transect
4.23
1.33
5.56
1.13
23
T- Cal
0.54
0.83
0.61
0
41
T – Tab
(P = 0.05)
2.01ns 2.04ns
1.98ns 2.04ns 1.96**
Density, Abundance and Biomass of Sclater’s
Guenon
Table 2 lists all parameters upon which the analysis
was based and the respective values obtained in each
study year. The survey designs for all the previous
years were slightly different from the present study.
The formers all used point survey method while line
transect method was employed for this study. As a
consequence of this survey method, the population
data obtained in 2012 showed an increase in
cluster/group density when compared with the data
obtained by Egwali
et al.
(2005). However, the
individual population (82 individual/km
2
), Total
population density (57.40 individual/km
2
), Biomass
density (266.5 kg/km
2
)and Total population biomass
(190.35kg/km
2
) of Sclater’s guenon obtained for the
present study was less than that of Egwali et al
.
(2005)
and Okon (2004). These values obtain for the present
study was higher than those obtained by Udoedu
(2004) and Ibong (2002).


