International Journal of Marine Science 2015, Vol.5, No.52: 1-8
6
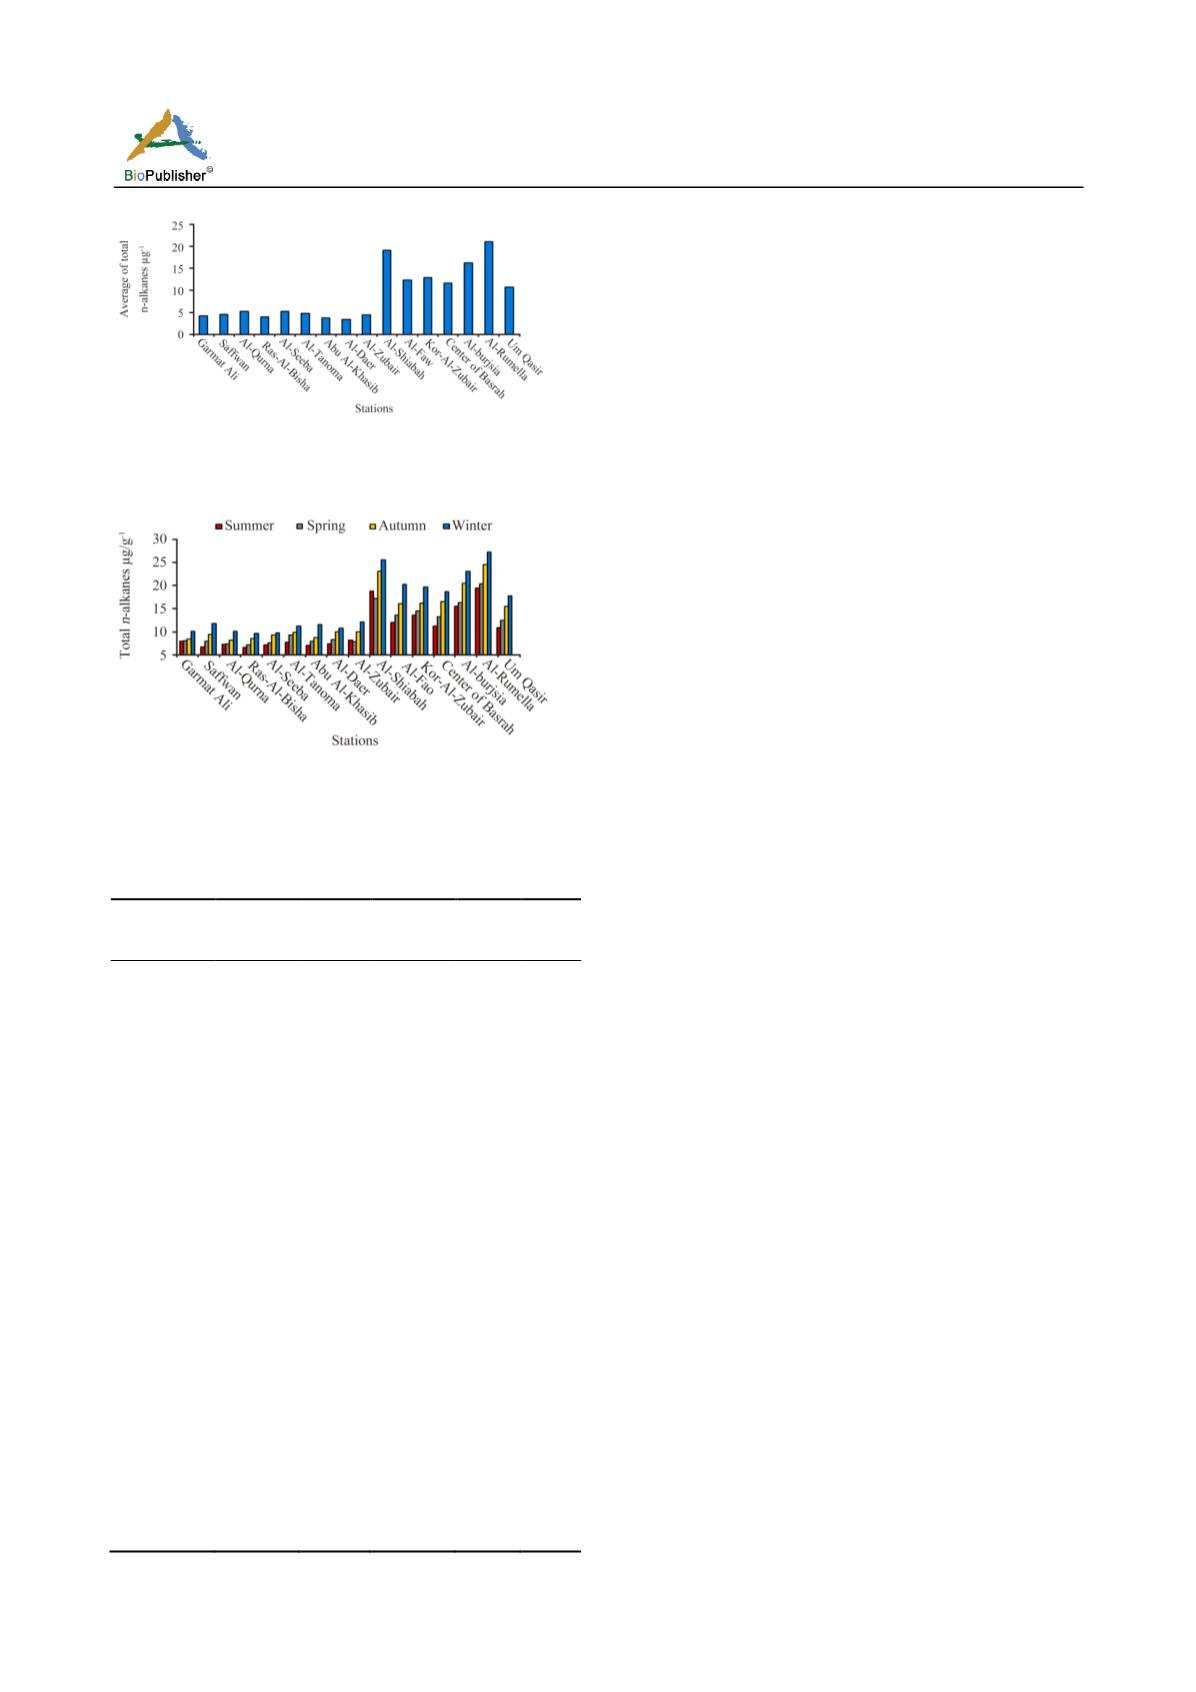
Figure 2 The spatial profiles of the total of
n
-alkanes concentrations
average of the Basrah city soil
Figure 3 The spatial
trend of
the total of
n
-alkanes concentrations of
the Basrah city soil during different season
Table 6 Total of
n
-alkanes concentrations (µg g
-1
) of the soil of
Basrah city during different season and % TOC values
Stations
Summer Spring Autumn Winter %
TOC
Garmat Ali
3.535
3.689
4.175
6.145
0.85
Saffwan
2.051
3.536
5.363
8.078
0.46
Al-Qurna
2.719
2.959
3.888
6.098
0.81
Ras-Al-
Bisha
1.997
2.575
4.208
5.52
0.75
Al-Seeba
2.612
3.182
5.174
5.76
0.70
Al-Tanoma 3.326
5.131
5.796
7.431
0.82
AbuAl-
Khasib
2.519
3.594
4.481
7.782
0.84
Al-Daer
2.927
3.949
5.946
6.946
0.76
Al-Zubair
3.885
3.467
5.983
8.533
0.61
Al-Shiabah 16.439 14.547 21.458
24.424 0.53
Al-Fao
8.331
10.308 13.236
18.157 0.73
Kor-Al-
Zubair
10.23
11.324 13.31
17.44
0.63
Center of
Basrah
7.509
9.806
13.705
16.204 0.64
Al-burjsia
12.481 13.45
18.451
21.418 0.64
Al-Rumella 17.244 18.286 23.189
26.345 0.66
UmQasir
7.03
8.86
12.51
15.12
0.67
Total
104.835 118.663 160.873 201.401
Average
6.552
7.416
10.054 12.587
the most effective in the spring and summer seasons
of Basrah city soils.
The gas chromatographic profiles of
n
-alkanes in the
soil samples are shown in (Figure 4). The GC traces
are dominated by
n
-alkanes extending from C
11
to C
34
.
n
-alkanes, representing two distinct sources, are
evident on the basis of their distribution pattern in
samples collected. For stations Al-Rumella, Al-Shiabah,
Al-burjsia, Kor-Al-Zubairand, Center of Basrah,
Al-Fao, and Um-Qasir which the most abundant
n
-alkanes are generally C
14
to C
24
, while the least
abundant are the
n
-alkanes of C
27
, C
29
and C
31
. The
dominance of the
n
-alkanes in the range C
18
to C
24
,
suggests relatively petroleum inputs (Harji et al., 2008;
Wang et al., 2011). This has been verified by the
presence of a strong UCM in the GC profiles. Such
compounds, resistant to biological degradation, have
been considered as the environmental indicators of
long-term petroleum-related contamination (Jeng and
Huh, 2006; Punyu et al., 2013). The CPI is also an
index used for determining the sources of
n
-alkanes.
These stations presented lower values around 1.0
indicating inputs of
n
-alkanes from petroleum related
sources (Ekpo
et al., 2012; Zrafi et al., 2013) Figure (5
and 6) show the spatial trend of UCM and CPI in soil
of Basrah city. At stations Ras-Al-Bisha, Al-Qurna,
Al-Seeba, Garmat Ali, Abu Al-Khasib, Saffwan,
Al-Daer, Al-Tanoma, and Al-Zubair the main features
in GC profiles are notably different from the above
stations. In these stations, the long chain compounds
prevailed with the C max at C
27
, C
29
and C
31
and
presented an elevated odd to even carbon number
preference as reflected in the high CPI values. This
pattern is characteristic of higher plant waxes and thus
reveals the occurrence of prominent terrestrial inputs
to these sampling sites (Harji et al., 2008). However,
the
n
-alkanes profile indicates that contribution from
plant wax hydrocarbons is over shadowed in samples
by
n
-alkanes of petroleum origin. This is obvious by
the ratio of pristane to phytane and the presence of
high relative abundance of UCM.
The pristane and phytane (isoprenoid compounds)
were present in most soil samples. They are common
indicators for petroleum contamination. The pristine
to phytane ratio varies between oils and is thought
to reflect the depositional environment of the
original source rocks (Wang et al., 2011). A relative high


