International Journal of Marine Science 2015, Vol.5, No.50: 1-5
3
3 Results and Discussion
3.1 Growth studies of
Clostridium bifermentans
in
presence of Lead
Growth pattern of
Clostridium bifermentans
in
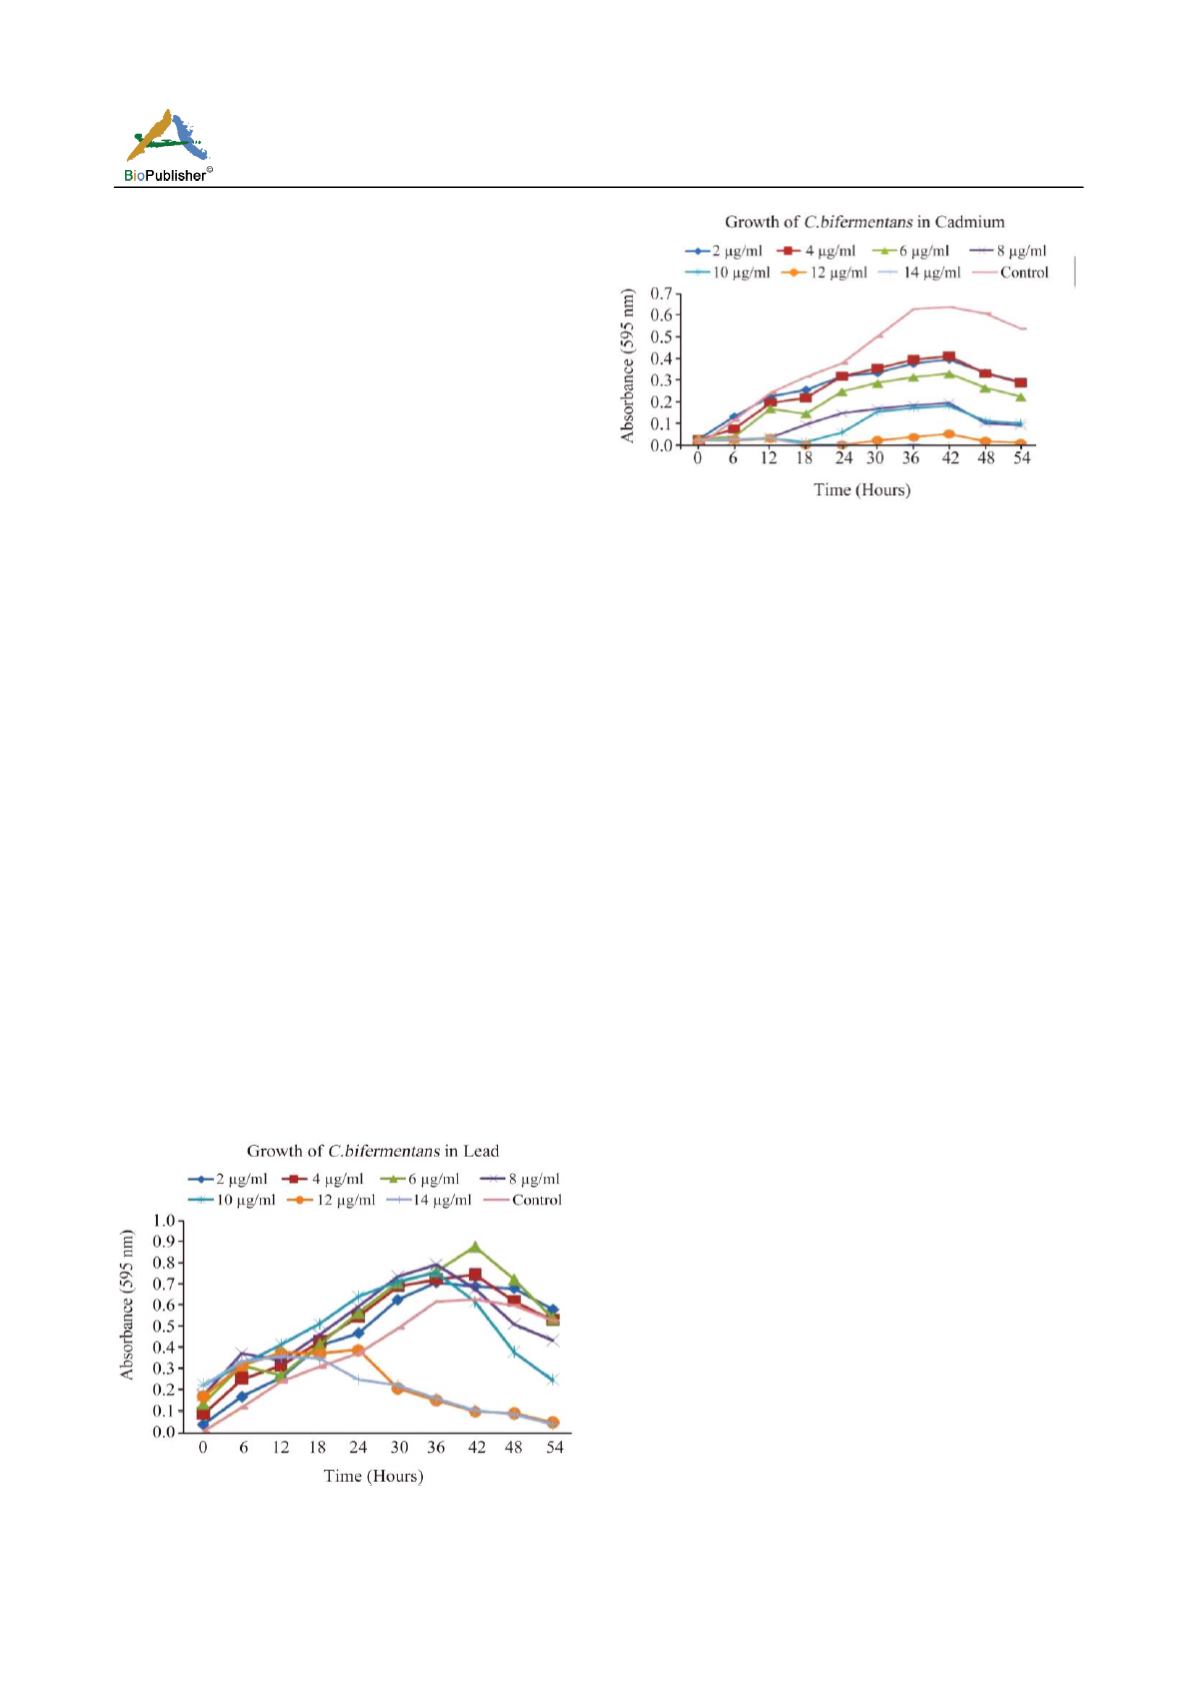
different concentrations of lead is given in figure 2.
Control showed a clear lag, log, stationary and death
phase within 54 hour incubation period. Culture
incubated with 2, 4, 6, 8, 10, 12 and 14µg/mL
concentrations of lead have higher growth compared
with control culture. Decreasing pattern of growth was
noticed in concentrations 12 and 14 µg/mL. No visible
turbidity was noted after 10 µg/mL concentration of lead.
Growth pattern of
Clostridium bifermentans
have
higher growth rate in presence of lead but low tolerance
compared with aerobic bacterium. Kafilzadeh et al.,
(2012) showed that aerobic bacteria
bacillus
spp. And
corynebacterium
spp. have maximum growth even at
high concentration (700 µg/mLlead acetate). They
observed a short pause in the growth of all bacteria
when adding lead in the half of logarithmic phase
growth. The same trend is noticed in the present study too.
3.2 Growth studies of
Clostridium bifermentans
in
presence of Cadmium
Control showed higher growth rate compared with
other test cultures incubated with different concentrations
of cadmium. Growth was not observed significantly
after 10 µg/mL concentration of cadmium (Figure 3).
The studies of Mathivanan and Rajaram (2014)
reported that the growth curve patterns of cadmium
resistant isolates were entirely different based on the
concentration of cadmium. As the added concentration
Figure 2 Growth patterm of
C.bifermentans
in different
concentrations of lead
Figure 3 Growth pattern of
C.bifermentans
in different
concentrations of cadmium
of cadmium increased, the growth rates of cultures
decreased. Similar results were noted in the present
study,
ie
. decreasing growth with increasing concentration
of cadmium.
3.3 Growth studies of
Clostridium bifermentans
in
presence of Copper
Figure 4 showed growth of
Clostridium bifermentans
in different concentrations of copper. Control showed
higher growth within 54 hour incubation. Growth rate
of
Clostridium bifermentans
was less in presence of
copper. The bacterium exhibited no significant lag, log
and stationary phase in presence of copper. But visible
turbidity was noted up to 8 µg/mL concentration.
Growth rate of halophilic bacterial strain MA2 has
exhibited drastic decrease in the presence of copper
(Osman et al., 2012). The present study also noticed
growth of
Clostridium bifermentans
in different
concentrations of copper is decreasing compared with
control.
3.4 Heavy metal tolerance of
Clostridium bifermentans
Clostridium bifermentans
has showed maximum
tolerance to different heavy metals like Cd, Pb, and Cu
respectively (Figure 4). The strain showed markedly high
tolerance to lead and cadmium at MIC of 12 µg/mL
followed by copper (10 µg/mL). Thus from the study
it is clear that the isolated strain
Clostridium bifermentans
has multiple resistance to different heavy metals.
Cochin estuary showed high metal contamination
especially Pb, Cd, Cu, Zn, Ni and Hg. (Balachandran
et al
.,
2005; Mohan et al., 2012, 2014). The present
study indicates that heavy metal contamination in this
area exerting metal tolerance to the bacterium


