International Journal of Mol. Ecol. and Conserv 2015, Vol.5, No.7, 1-10
3
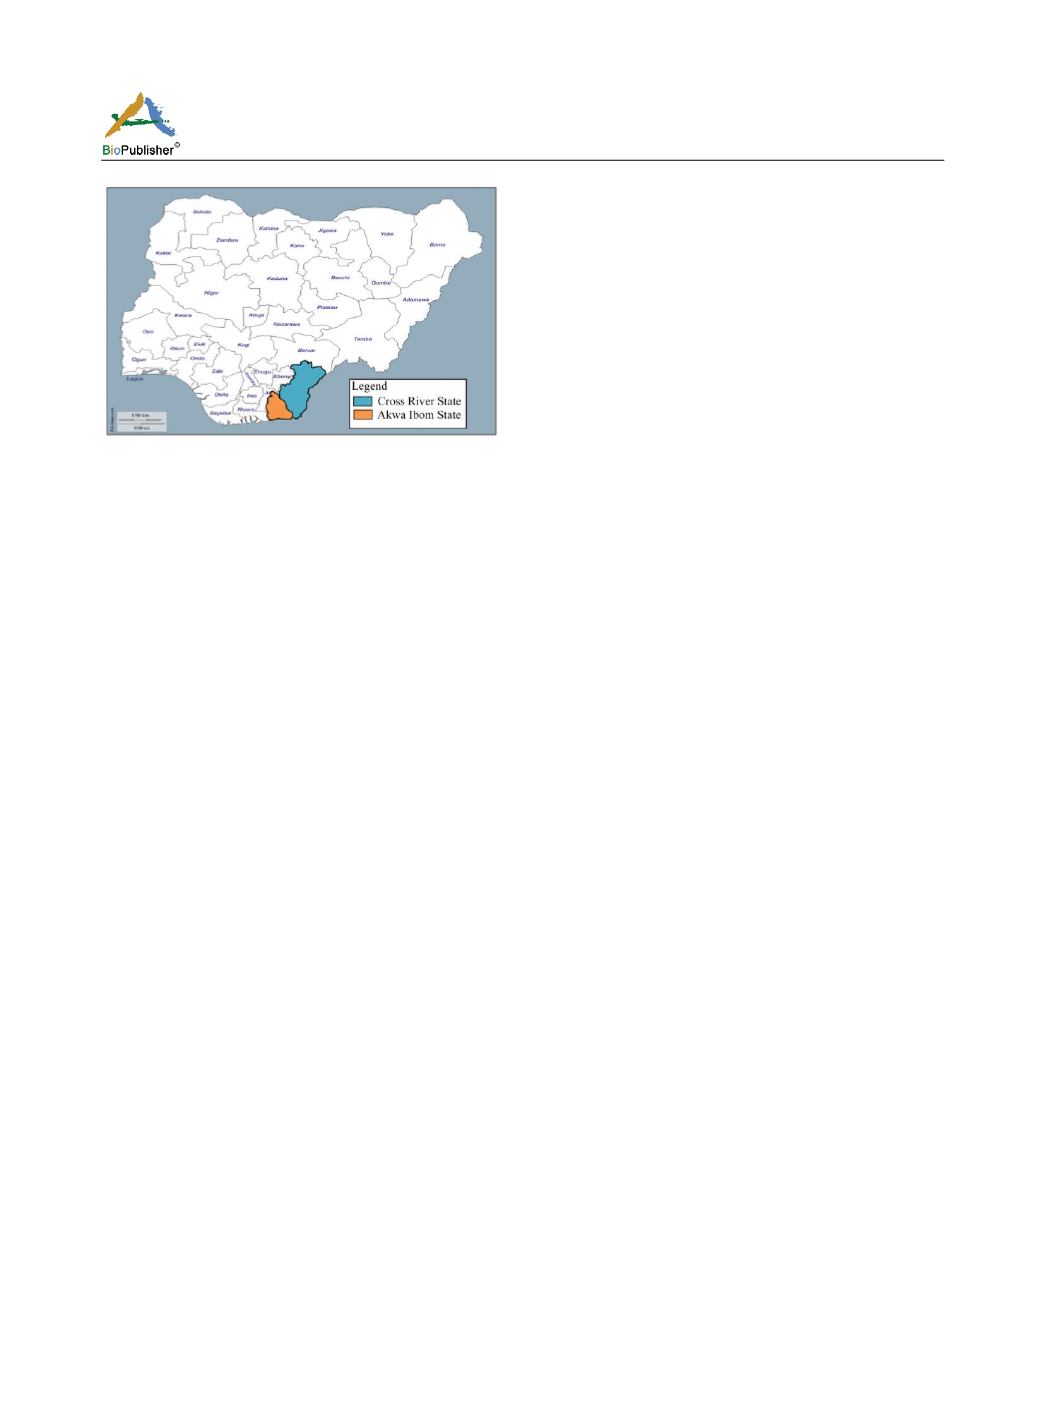
Figure 1 Map of Nigeria showing the study areas
clusters based on senatorial district (Uyo, Ikot Ekpene
and Eket). Random sampling procedure was thereafter
utilized to select two Local Government Areas (LGA)
from each cluster. Purposive sampling procedure based
on availability, accessibility (cultural restrictions) and
size of the forests, was finally utilized to select one
sacred forest from each LGA.
In Cross River State, the same cluster sampling was
used namely Northern, Central and Southern, as the
first stage sampling. Purposive sampling was hereafter
adopted in selecting two (2) LGAs from North and
Central senatorial districts and one sacred forest was
studied in each of the selected LGA. As in Akwa Ibom,
the factors considered were; availability, accessibility
(cultural restrictions) and size of the forests. In both
cases, only the forest whose sizes were approximately
one hectare (1ha) and above, were considered in order
to accommodate the sampling units. The following
sacred forests (Table 1) were finally selected as sample
areas for studies.
3 Sampling units
The study was carried out between May 2008 and
February 2009. The forests were studied using 20m x
20m Temporary Sample Plots (TSP) as recommended
by Alder and Synnoth (1992). Maps produced by a
transverse survey of each sacred forest, were grided
into 20m x 20m TSP and Fixed effect Model (Equal
Sample Allocation) as discussed by Wahau (1994) was
used to select five 400m
2
sample plots totaling 2 000m
2
(0.2Ha) within the core of each sacred forest. All the
20m x 20m plots bordering the free area were not given
consideration to avoid edge effect. Prismatic compass
was used to locate the selected plots. Adjacent plots
were considered where the intended plot had obstacle
like steep valley, massive cluster of plants with thorns
e.g. rattan, or a restricted/prohibited cultural site like
shrines.
4 Data collection procedure
The procedure for data collection involved tree
identification, enumeration and measurement of
merchantable height of tree species with diameter at
breast height (dbh) ≥ 10cm, using sunto clinometer and
diameter tape.
5 Data processing and analysis
Every tree measured and noted in the field was
identified taxonomically using Keay (1989), Etukudo
(2000) and (2003) as guide. The life-form spectra of
various plant communities encountered in the study
areas were presented in line with Raunkareir Life-form
Classification Scheme (Raunkareir, 1934) as follow:
(a) Megaphanerophytes (MgP) -Trees over 30m high
(b) Mesophanerophytes (MeS) -Trees from 8-30m high
(c) Microphanerophytes (MiP)-Trees and shrubs
between 2-8 m height.
Distribution status of each family was based on its
availability among the study areas. Any family that
appeared in at least 7 of the 8 study areas was considered
Very Common (VC), a family that appeared in at least 4
of the study areas was considred a being common (C),
while a family which appeared in less than four study area
was considered as Not Common (NC).
Data gathered from each 20x20m TSP were summed
up to represent the 2000m
2
(0.2Ha) sample area of each
sacred forest and later extrapolated to per hectare bases.
The site Diversity/Richness Index (D) was determined
using equation (1) adopted by Whittaker et al. (2001).
D = S / Log A (1)
Where; D = Richness (Diversity Index), A= Sample
Area in square meters = 2000m
2
, S = No. of species in a
sample of standard size A.
Results
i.
Structure of the sacred forests
The result obtained indicates that all the sacred forests
in Akwa Ibom State (Akoho Itit, Abaam Itak, Akai
Mbiam, Akai Uya, Akai Anwa Ibok and Utai Ikot) had


