International Journal of Marine Science 2015, Vol.5, No.16, 1-12
10
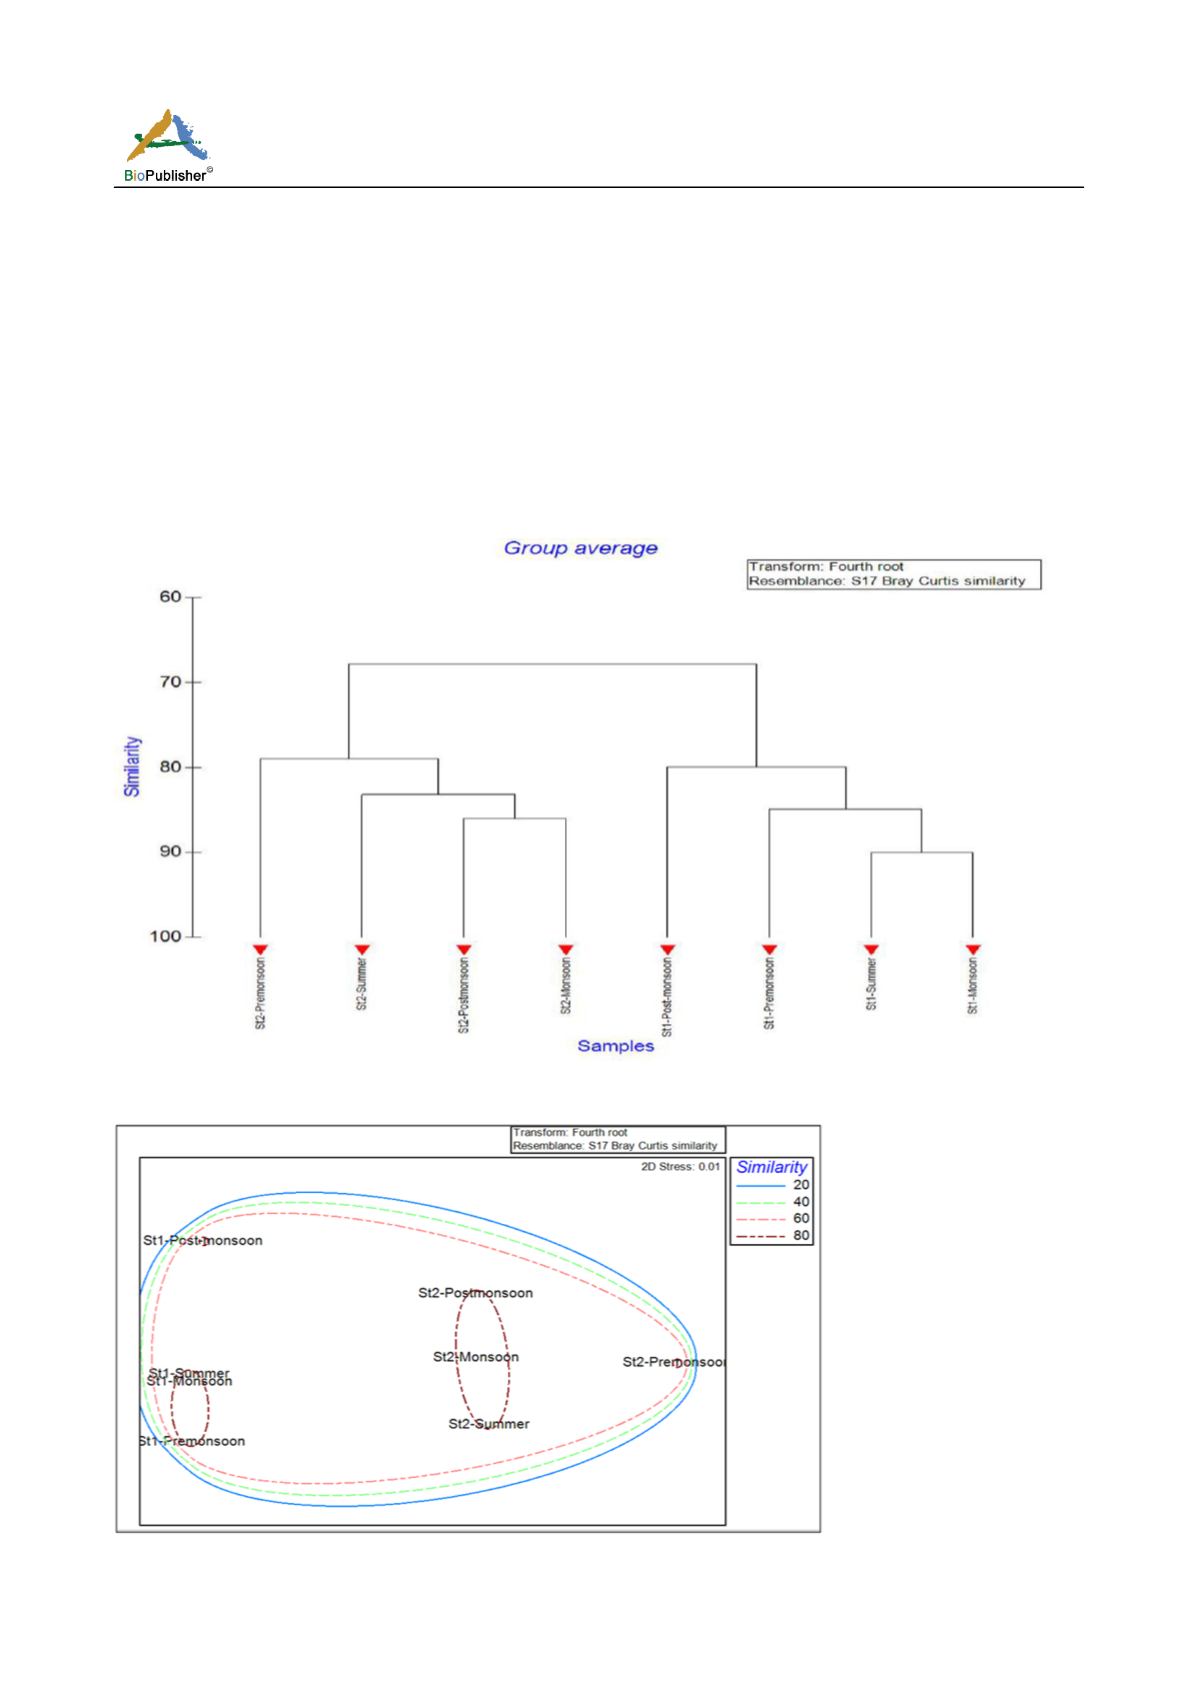
From the resulting dendrogram, it was not possible to
classify the results according to stations, but it was
possible for seasons. The monsoon season showed
separation from the remaining samples. In the
dendrogram plot (Figure 7), it was found that all the
monsoonal samples were ordinated separately from all
other samples which conform to the dendogram.
The dominant species belonging to all groups are
shown in Table 1. Classification analyses (using
Bray–Curtis similarity) followed by an ordination
through MDS on benthos abundance data
(numbers/0.1 m
2
)
independently for infauna (86
species) was undertaken. The results of hierarchical
clustering and MDS ordination, respectively, on
species abundance data representing 2 stations
during four seasons (post-monsoon, summer,
pre-monsoon and monsoon) (Figure 8). The
two-dimensional plot, otherwise referred to as
Ellipse, supported the MDS ordination, and it
showed that the monsoonal samples were occurring
outside the contour.
Figure 7 Dendrogram showing grouping of stations sampled during different seasons for infauna
Figure 8 MDS plot for all seasons and stations of Cuddalore and Parangipettai


