International Journal of Marine Science 2016, Vol.6, No.58, 1-8
2
between 6671–28064 ind./m
3
. Whereas Jebir (2013) reported that the zooplankton was between 21–53211 ind./m
3
in south Shatt Al-Arab River. Moreover Abbas et al. (2014) studied the abundance and distribution of Zooplankton
in the northern sector of Shatt Al-Arab, zooplankton density it was ranged between (79–65170 ind/m
3
), where
Cirripede larvae dominated the zooplankton community at all the stations. Cladocera was second in number,
followed by Copepoda.
Materials and Methods
Study area
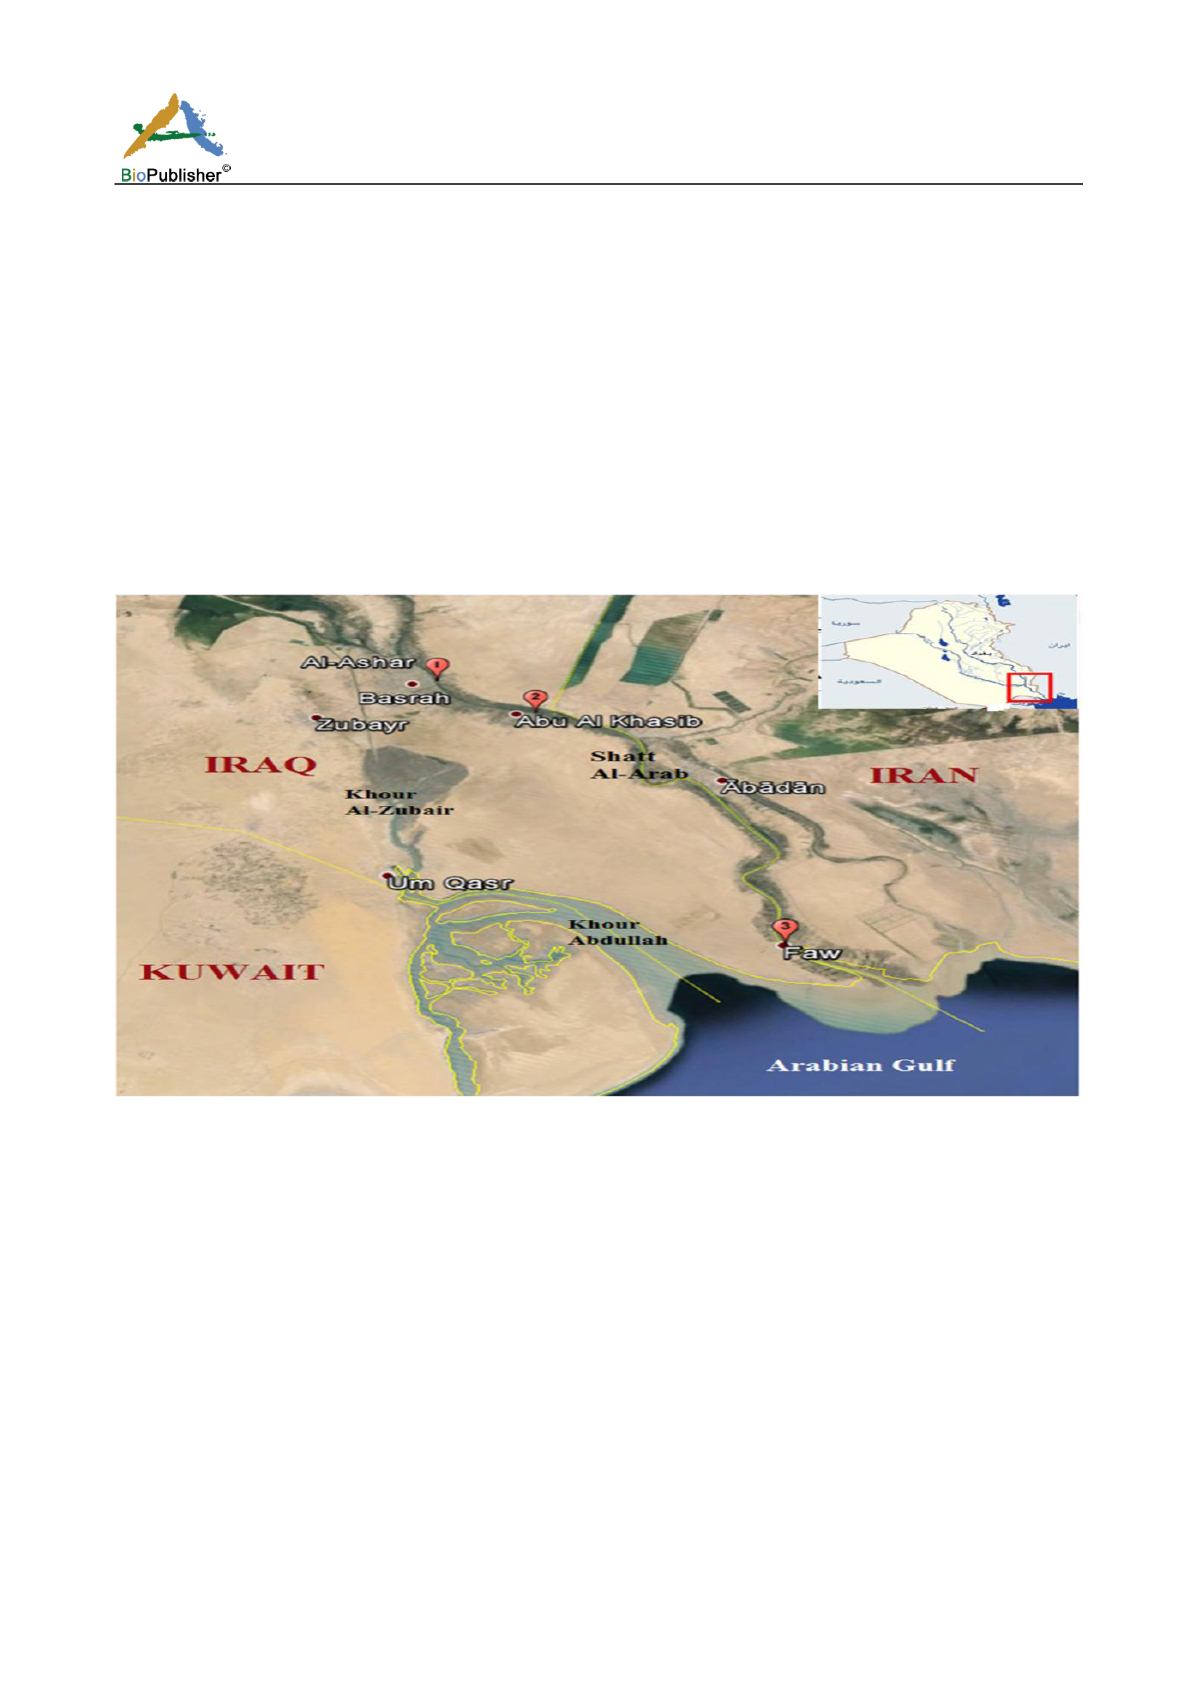
Samples were taken seasonally from three stations south of the Shatt Al-Arab River, (Fig. 1). The first station near
the Basrah city centre at Al-Ashar region at latitude ((30° 31ʹ 32.39״) and longitude (47° 50ʹ 33.43״) (near Marine
Science Centre anchorage) this station is affected by sewage coming from side branches like Al-Ashar and
Al-Khandaq creeks, in addition to excretions of boats. Second station in Abu Al-Khasib region at latitude (30° 27ʹ
49.88״) and longitude (48° 00ʹ 30.89״) versus one of the branches of Abu Al-Khasib, and the third station in
Al-Faw region (near the oil anchorage and boats of fishing) at latitude (29°59ʹ 20.06״) and longitude (48° 28ʹ 02.22״).
Fig. 1 Map of lower Mesopotamia showing the sampling stations taken by using Google Earth program.
Sample collection
Seasonally zooplankton samples were collected at 2013 from surface water of Shatt Al-Arab using a 0.085 mm
mesh-sized net with 40 cm mouth opening. A digital flow-meter was mounted in the middle of the mouth of the
zooplankton net. The net was horizontally towed behind a boat running at its lowest speed for 10-15 minutes, and
then the zooplankton that has been retained by the net was collected. The reading of the flow meter was taken
before and after towing. At each station, samples of zooplankton were collected, transferred to containers (plastic
bottles). The plankton samples were immediately fixed in 4% formaldehyde.
Water temperatures were measured by a thermometer with 0.1ºC sensitivity. Salinity, pH and TDS measurements
were performed by YSI 556 MPS. Dissolved oxygen concentration measured by Winkler method. Turbidity was
measured by HANNA instrument, Microprocessor Turbidity Meter HI 93703.
In the laboratory, samples were poured into a graduated vessel, and diluted if densely populated. Then a 10 ml
subsample was taken and placed in a Bogorov chamber, examined and counted under a dissecting microscope.
This procedure was repeated for three times, and then the whole sample was examined for the rare species.


