International Journal of Marine Science2016, Vol.6, No.50, 1-9
4
complement the time series of phytoplankton biomass fields, monthly products of Sea Surface Temperature (C°)
from Advanced Very High Resolution Radiometer (AVHRR) were also obtained and analyzed. Accuracy of
retrieved chlorophyll concentrations using a universal algorithm for global oceans are within ±35% of in situ
concentrations in accordance with the goal set by ocean colour missions. Since the data analysis is based on
basin-wide spatial and temporal variations in pigment patterns, it is assumed that spatial and temporal changes
seen in satellite data on monthly time scales are the result of changes in population structure of phytoplankton.
Annual mean
Chl-a
and SST for each year and a decadal (1998-2008) were computed from the time–series
datasets of ocean colour and SST. Bathymetry image was generated for the same region to know the depth of
ocean basin. Spatial anomaly index was computed as the difference between mean climatic value of each pixel
and the basin scale climatic mean of north Indian Ocean normalized to basin scale standard deviation. This
procedure not only removes the spatial variability caused due the inert-annual variations but also make the data
dimensionless. Primary production in gC m
-2
year
-1
of the north Indian Ocean was also estimated using an
analytical model (Platt and Sathyendranath, 1988) incorporating the decadal mean
Chl-a
data as an input coupled
with parameters of photosynthesis-light relationship, sea surface irradiance, day length, photic depth and
attenuation of light within the water column.
4. Results and Discussions
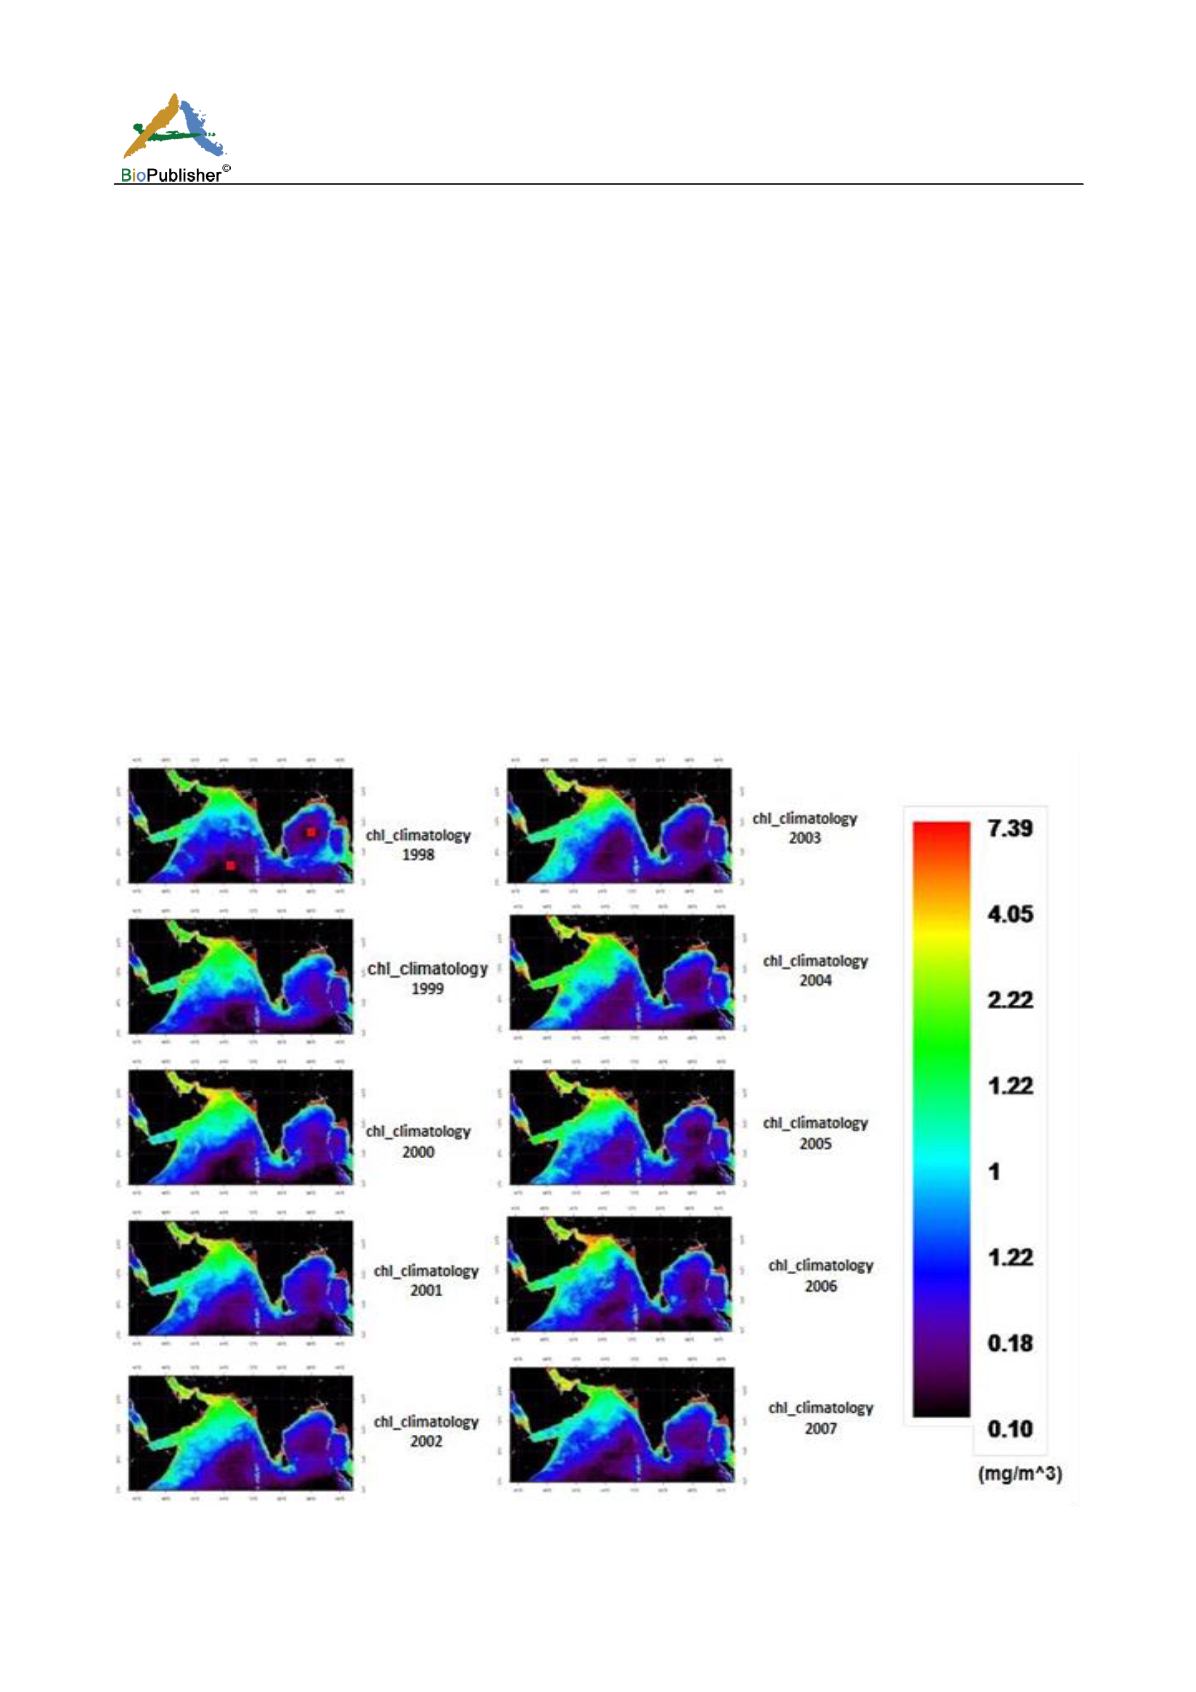
Annual mean
Chl-a
images from 1998-2007 are shown in figure1. Mean
Chl-a
values ranged from 0.1 to ~7.5
mg.m-3in the Indian Ocean basin.
Figure 1: Time series of annual mean chlorophyll
a maps.


