International Journal of Marine Science 2016, Vol.6, No.44, 1-8
2
Materials and Methods
Samples for our study was collected during the exploratory cruises of the FSI vessels
Matsya Shikari
(Combination Trawler, OAL - 39.5 m, GRT – 352 MT.) and
Matsya Darshini
(Purse-Seine cum Pelagic Trawler,
OAL - 36.5M, GRT - 268.8 MT.) during the period 2006-2010. The gears used for survey were 12.92 x 12.92
fathom Mid water Trawl & 45.6 m Expo-model Fish Trawl, 34 m Fish Trawl, 36.2 m Cephalopod Trawl and 34 m
Shrimp Trawl. The data collected from Lat. 16°N – 20°N to Long. 83°E -85°E was utilized for the study. The
samples collected were subjected for morphometric measurements. The specimens were measured for total length
(TL +/- 1cm, FL+/- 1cm) and weight was taken to the nearest gm. Specimens were dissected to study the maturity
and gut contents. The data collected was analyzed for the morphometric relationship such as total length (TL) -
fork Length (FL). The parameters for both the sexes were regressed with each other with the help of the linear
equation Y= a +bX, ‘r’ being the correlation coefficient. The relationship W = aL
b
(Le Cren, 1951) was used for
the length weight analysis where W is the weight of the fish in gm and L is the total length in cm. The relationship
was expressed in the logarithmic form as: Log W = log a + b log L. The male to female ratio (M: F) was determined.
A total of 1849 specimens collected during the period 2006-10 were taken for in depth analysis. Various methods
in the FAO-ICLARM Stock assessment tool – FiSAT-II software (Ver.: 1.2.2, 2005) were used to analyze the
length-weight relationship, growth parameters such as L∞ and K, natural mortality(M), fishing mortality(F) and
total mortality Z, recruitment pattern, and virtual population analysis. Powell-Wetherall’s Method was also used
for estimation of L∞ and Z/K by pooling a time series of length-frequency data (Wetherall, 1986). Pauly’s
empirical equation (Pauly, 1980) was used for natural mortality (M) calculation. The total mortality (Z) was
estimated from length converted catch curve by taking the mean habitat temperature as 28.5°C. The recruitment
patterns – recruitment pulses from a time series of length frequency data was studied to ascertain the spawning
and recruitment period (Pauly, 1983, Moreau & Cuende, 1991). Length structured Virtual Population Analysis
(VPA) was used to ascertain the loss due to natural causes and fishing pressure at various length classes.
Results
Abundance
During the period 2006 – 2010,
S. guttatus
was the major species of seerfish landed by the survey vessels, forming
62.24% of the total landings of the seerfishes. Catch was more by pelagic trawling, in comparison with the
demersal gear. Although
S. guttatus
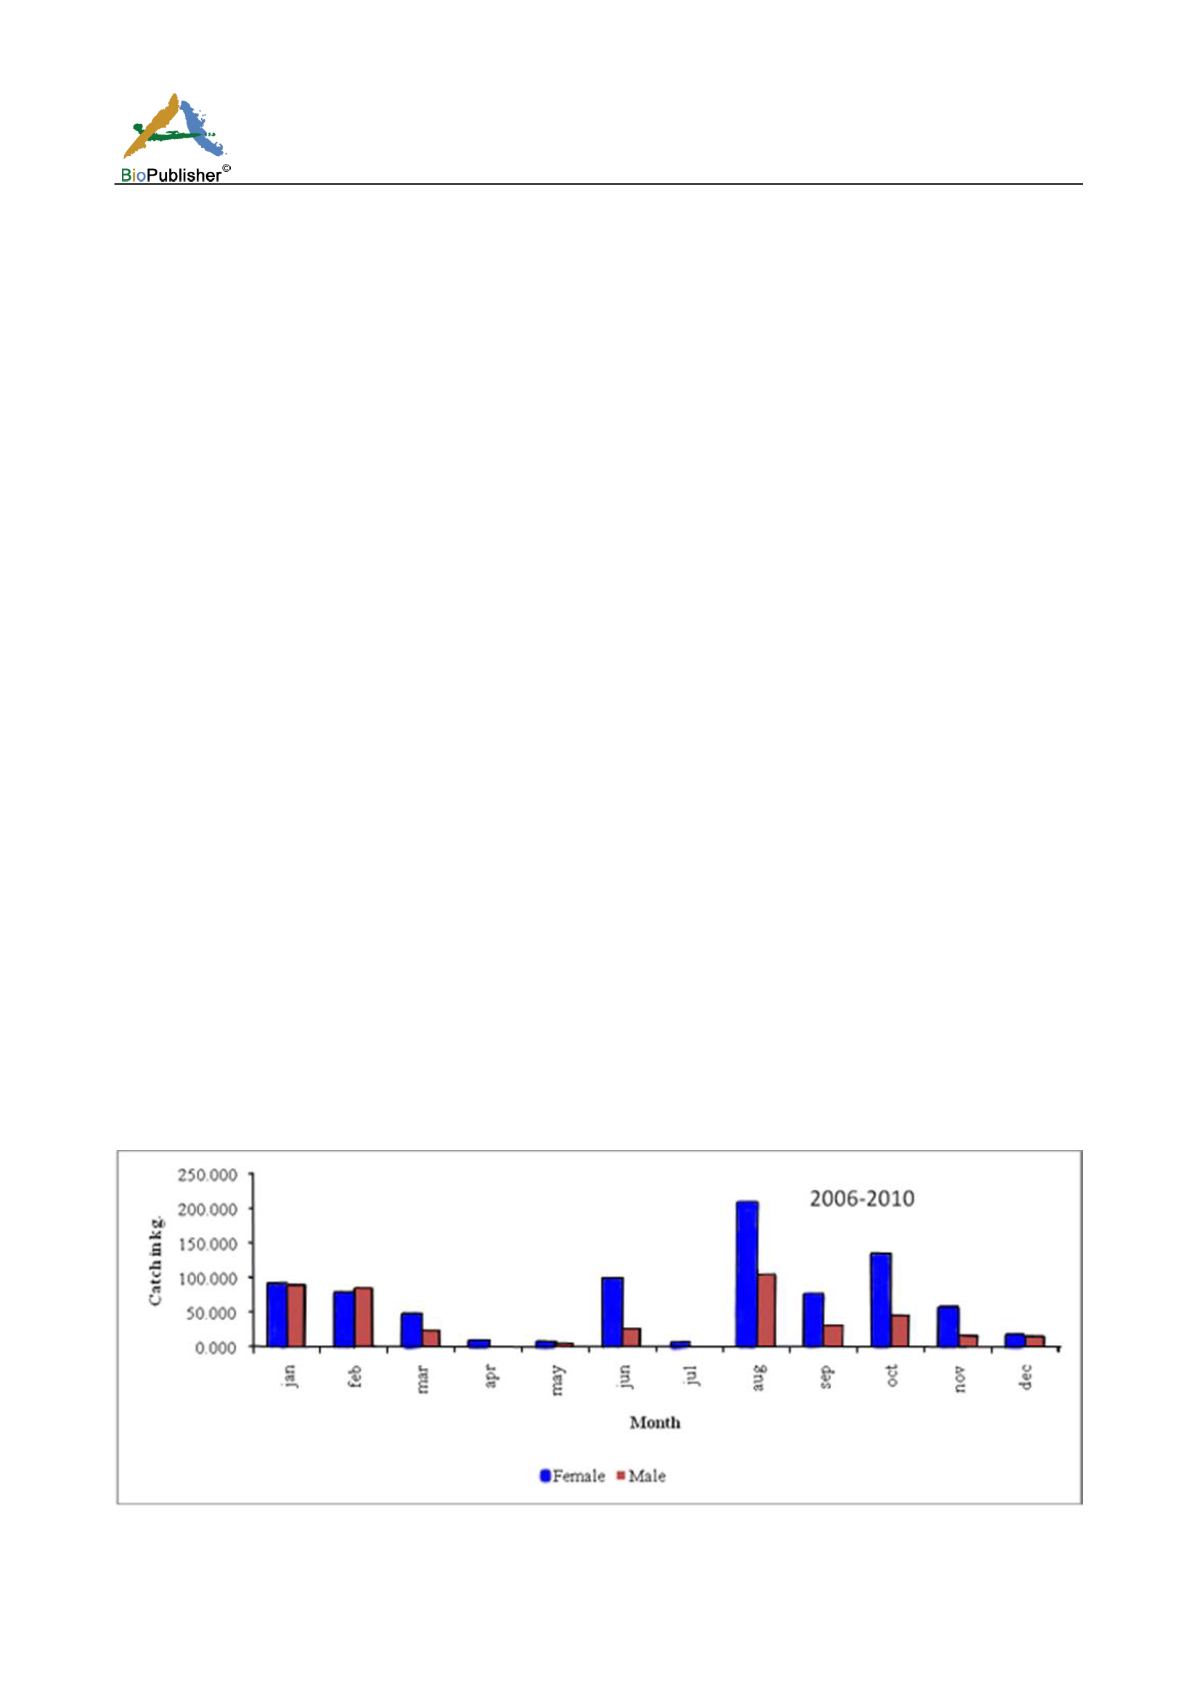
was represented in the catch throughout the year, the period August-October
and January-February yielded better catch (fig.1). It could be seen that the females were dominant during the
month of August followed by October, whereas male population was more during August followed by January.
The depth strata 30-100 m yielded a better catch rate than the depth zone 101-200 m. Latitude 17°N of the east
coast was more productive followed by 16°N, 18°N and 19°N.
Fig.1. Month-wise landings of
Scomberomorus guttatus
(male & female) during 2006-2010


