International Journal of Marine Science 2016, Vol.6, No.27, 1-22
17
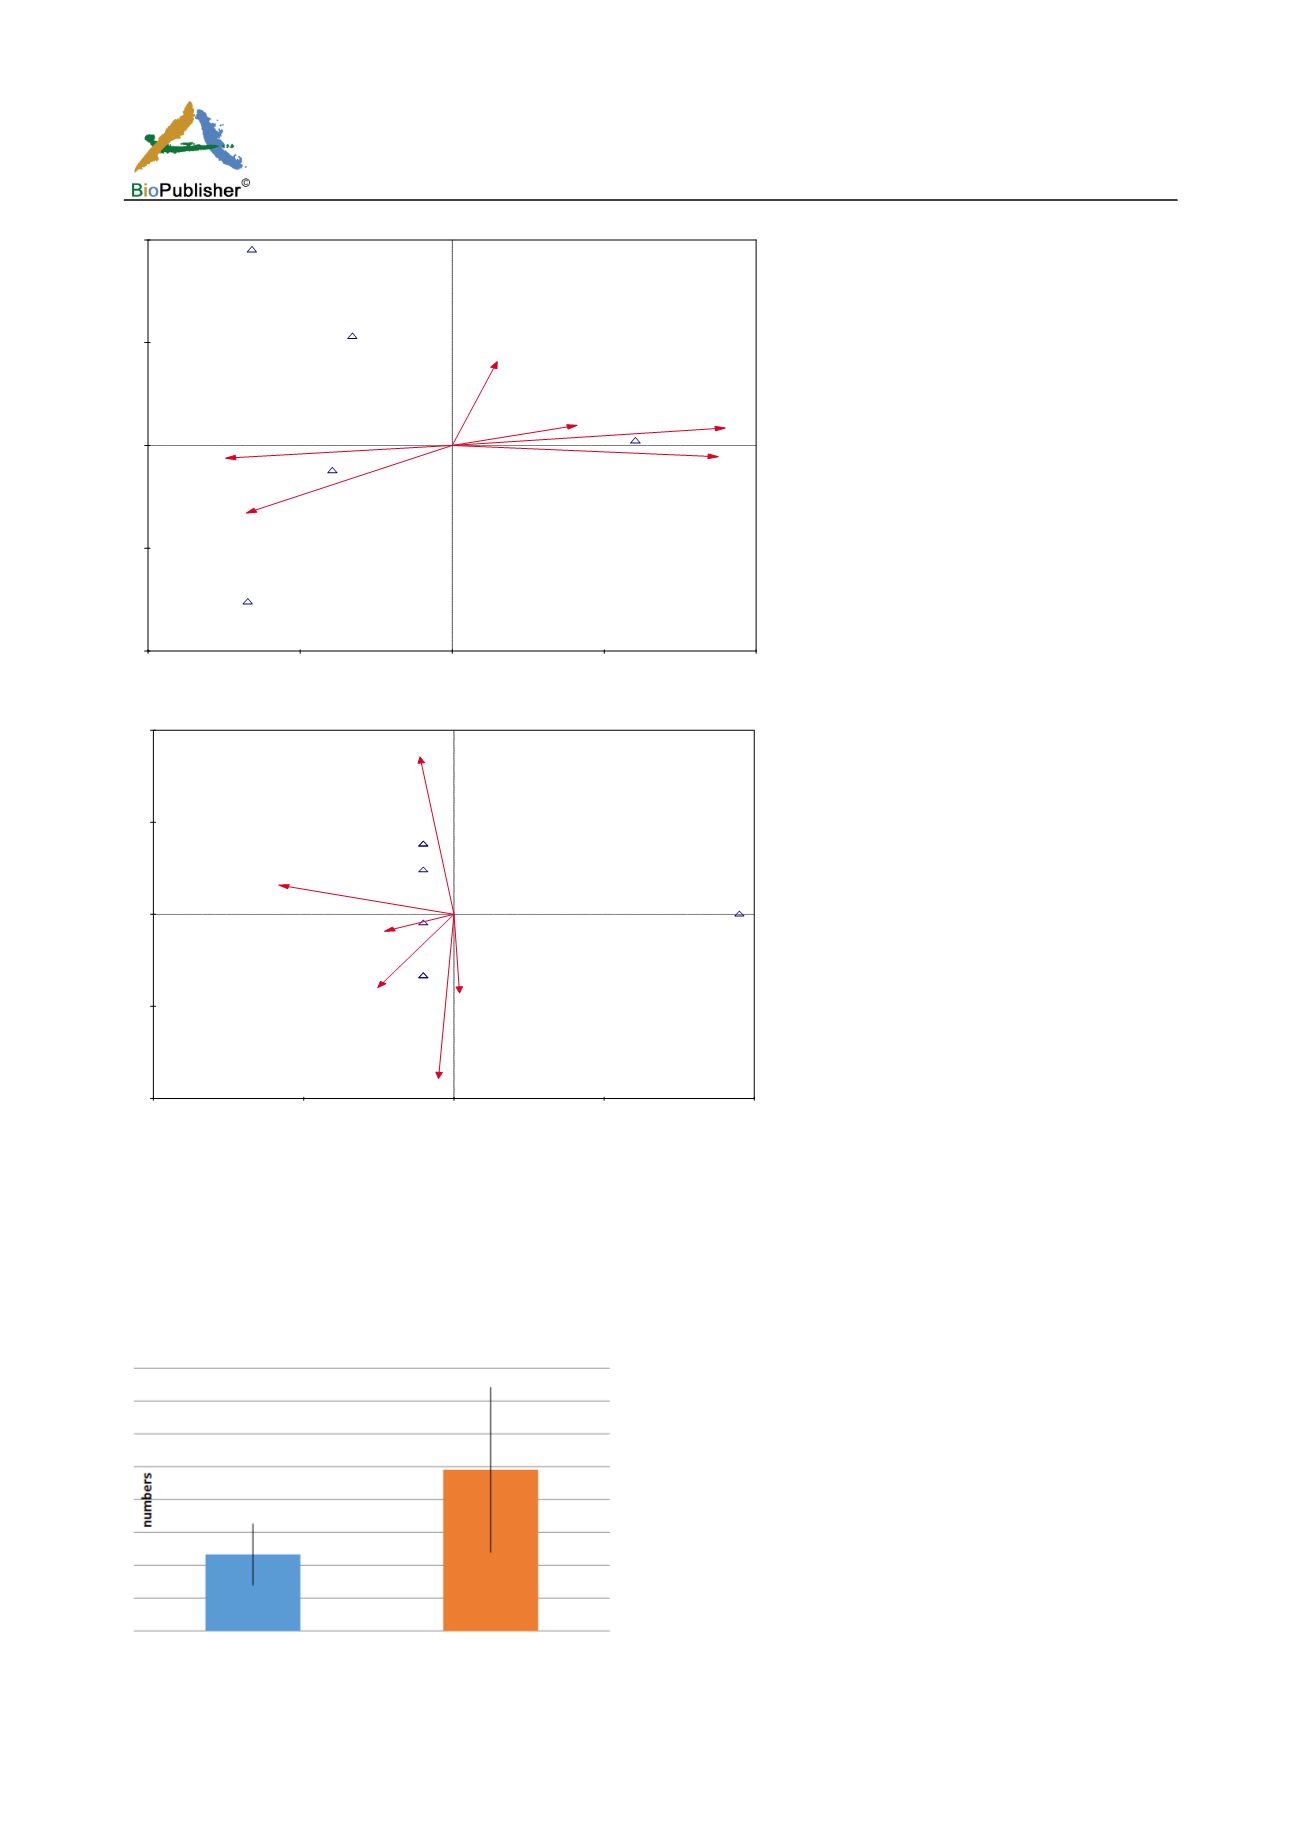
Figure 12: CCA biplot showing relationship between dominant fish species identified in the peak season of the semi-industrial fishery
Figure 13: CCA biplot showing relationship between rare fish species identified in the peak season of the semi-industrial fishery
3.5 Ichthyoplankton abundance
Larvae of fish found were mainly species of
Sardinella
in both seasons. In the peak season, a large number of
decapoda larvae
, primarily of the family Peneaidae and Portunidae were observed, as well as larvae of the species
Scyacium micrurum
. A higher abundance was observed during the peak season as compared to the lean season
(Figure 14). However these abundances were found to be not significant (Kruskal-Wallis H test, df = 1, P > 0.05).
Figure 14: Seasonal means of total ichthyoplankton abundance in the artisanal fishery (error bars represent standard deviation)
Note: The orange bar is peak season and blue bar is lean season
-1.0
1.0
-1.0
1.0
D.puncta
S.aurita
S.japoni
B.boops
D.rhoncu
TOTAL AL
REVELLE
PH
CARBONAT
Nitrates
Phosphat
-1.0
1.0
-1.0
1.0
S.crumen
E.gutiff
S.offici
P.arenat
C.crysos
A.thaxar
D vol ta
TOTAL AL
REVELLE
PH
CARBONAT
Nitrates
Phosphat


