International Journal of Marine Science 2016, Vol.6, No.27, 1-22
6
3 Results
3.1 Physico-chemical parameters
Table 1 shows the mean and standard deviations of physico-chemical parameters measured for both the lean and
peak fishing seasons of Teshie (artisanal fishery site which is nearer shore) and Tema (semi-industrial fishery site
which is further offshore). Mean temperature values reduced from 28.03
o
C in the lean season to 26.14
o
C in the peak
season. The semi-industrial fishery also experienced a decrease in mean temperature values from the lean season to
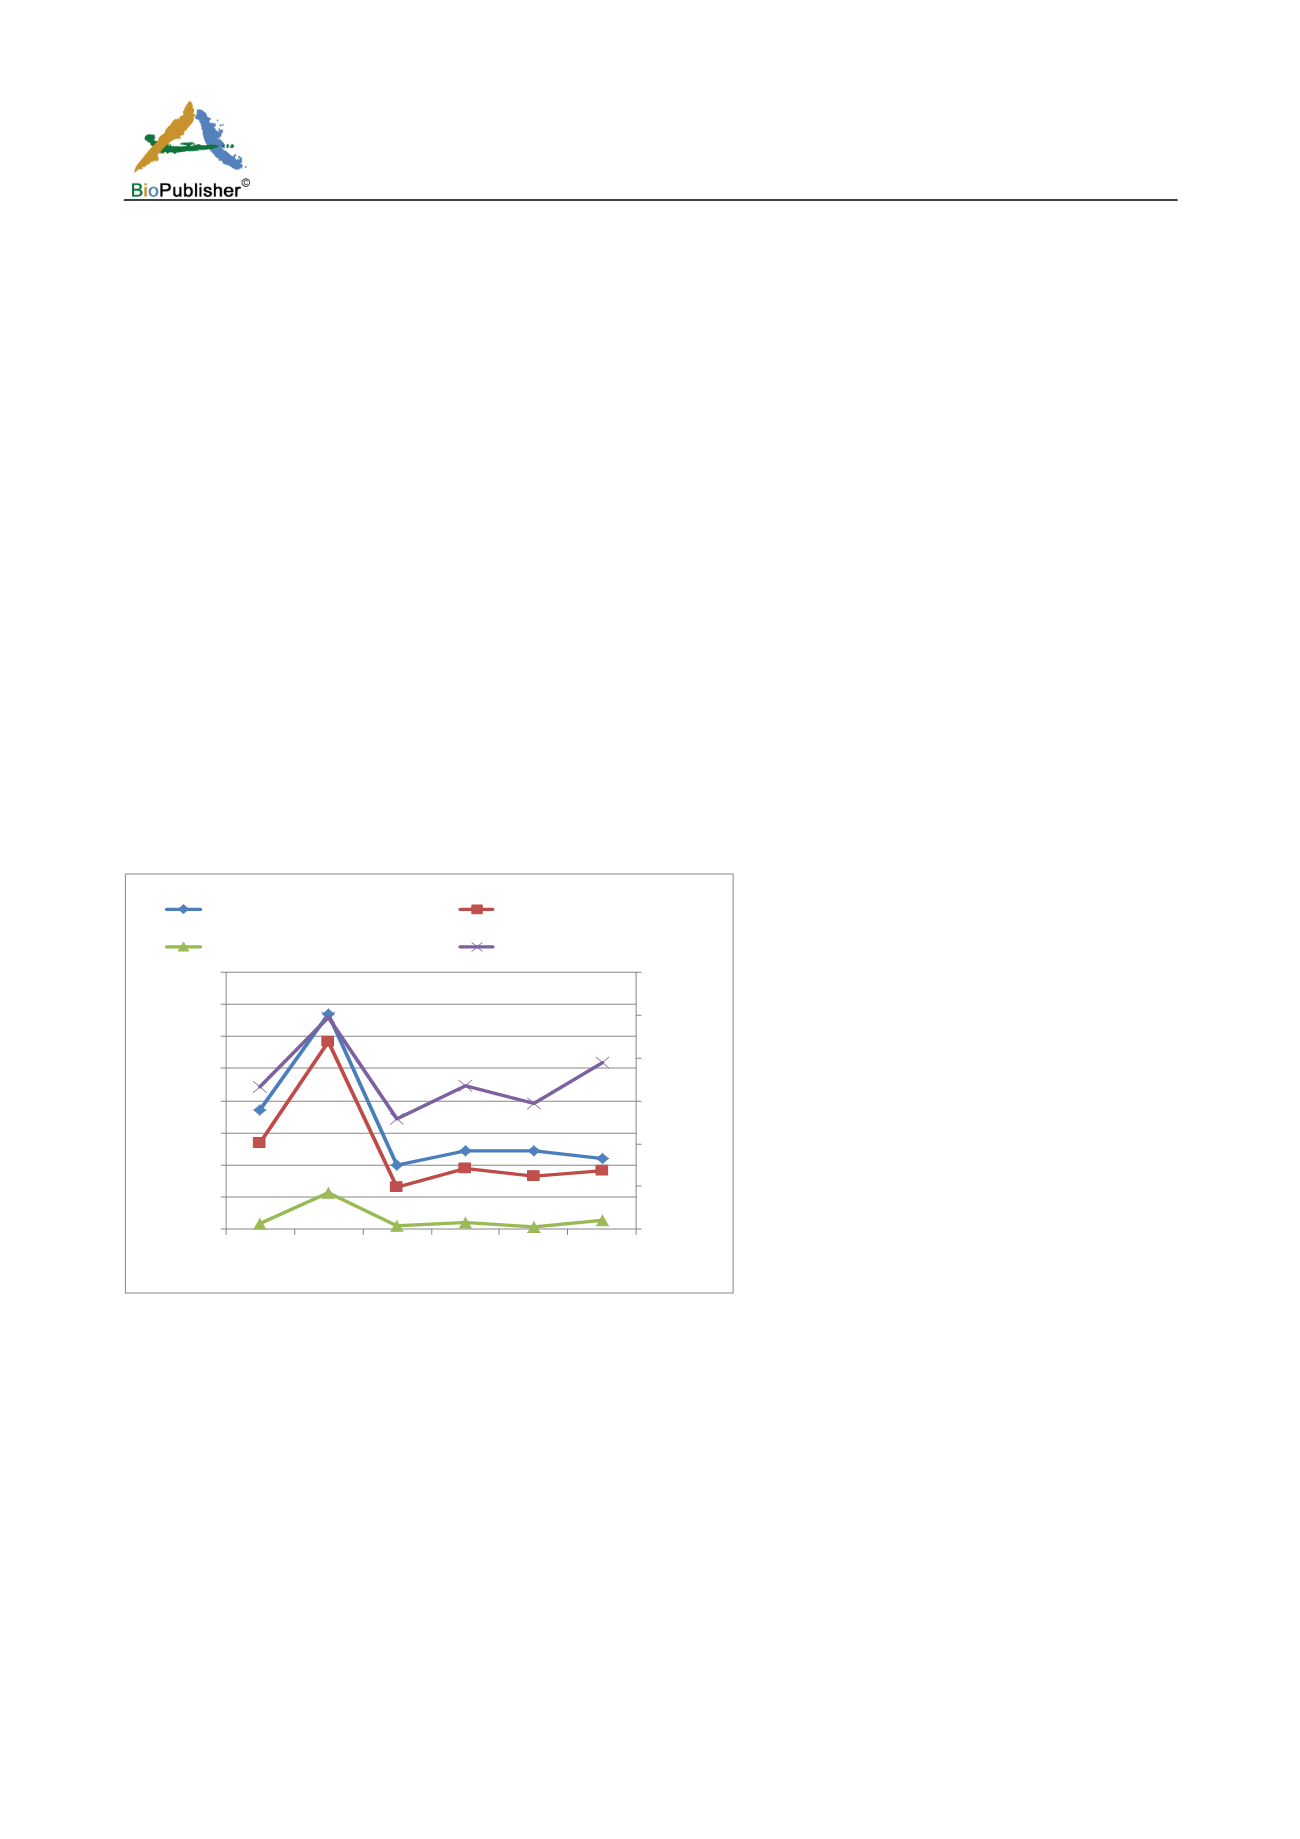
the peak season. Figures 2 and 3 show a decreasing trend of the seawater carbonate chemistry parameter total
alkalinity, for both the artisanal and semi-industrial fishery. Dissolved inorganic carbon and partial pressure of carbon
dioxide also show an overall decreasing trend, but tends to increase during the months of the lean seasons of the two
fisheries, resulting in one major peak in the artisanal fishery and two major peaks in the semi-industrial fishery.
Revelle factor for both fisheries however had an increasing trend. Figures 4 and 5 also show a decreasing trend for
the ocean acidification indicators (pH, aragonite saturation, calcite saturation, carbonate ion concentration) for both
the artisanal and semi-industrial fisheries, with the semi-industrial fishery having two major peaks.
The observations in whole study showed that male individuals showed high density as compared to female
individuals. High density of male individuals is due to some females dying after breeding. The male individuals
were also larger in size as compared to female individuals, which was convenient in reproductive activity
represents the sexual dimorphism. Difference in morphological sexual maturity was observed within sexes also.
From the present study it is suggested that Ocypodid crabs can be used as pollution indicators for assessment of
environmental health of our coastal areas.
Figure 2: Trend of seawater carbonate chemistry parameters for the artisanal fishery during the lean and peak fishing seasons of year
2013
Legend
L1 = first month of lean fishing season
L2 = second month of lean fishing season
L3 = third month of lean fishing season
P1 = first month of peak fishing season
P2 = second month of peak fishing season
P3 = third month of peak fishing season
P4 = fourth month of peak fishing season
P5 = fifth month of peak fishing season
0
2
4
6
8
10
12
0
500
1000
1500
2000
2500
3000
3500
4000
L1
L2
L3
P1
P2
P3
Revelle factor
TA, DIC, PCO2
Sample months
TOTAL ALKALINITY (umol/kg)
DIC (umol/kg)
PCO2 (uatm)
REVELLE FACTOR


