International Journal of Marine Science 2016, Vol.6, No.26, 1-13
9
indicates considerable contamination, and CF > 6 indicates very high contamination. Accordingly, the present
studied area was varied between low and moderate contamination regardless Cd in sediments which referred very
high contamination.
Table (4): Duncan’s multiple range test showing significant differences of metals in bivalve
B. variabilis
at different stations.
St.1
St.3
St.4
St.5
St.6
Cd
St.1
St.3
St.4
St.5
St.6
St.7
0.0470*
0.0405*
0.3479
0.0121*
0.0197*
0.0002*
0.2386
0.5104
0.6517
0.0050*
0.0000*
0.0001*
0.0878
0.1257
0.8012
Pb
St.1
St.3
St.4
St.5
St.6
St.7
0.6601
0.2790
0.0360*
0.2177
0.1019
0.1529
0.0143*
0.1123
0.0466*
0.2475
0.8185
0.4991
0.3248
0.5761
0.6224
Cu
St.1
St.3
St.4
St.5
St.6
St.7
0.0000*
0.0087*
0.0000*
0.0001*
0.0001*
0.0083*
0.8628
0.4124
0.3075
0.0061*
0.0500*
0.0714
0.3519
0.2544
0.7883
Zn
St.1
St.3
St.4
St.5
St.6
St.7
0.0001*
0.0119*
0.0071*
0.0000*
0.0001*
0.0000*
0.0091*
0.2518
0.5617
0.0001*
0.0000*
0.0001*
0.0004*
0.0294*
0.1051
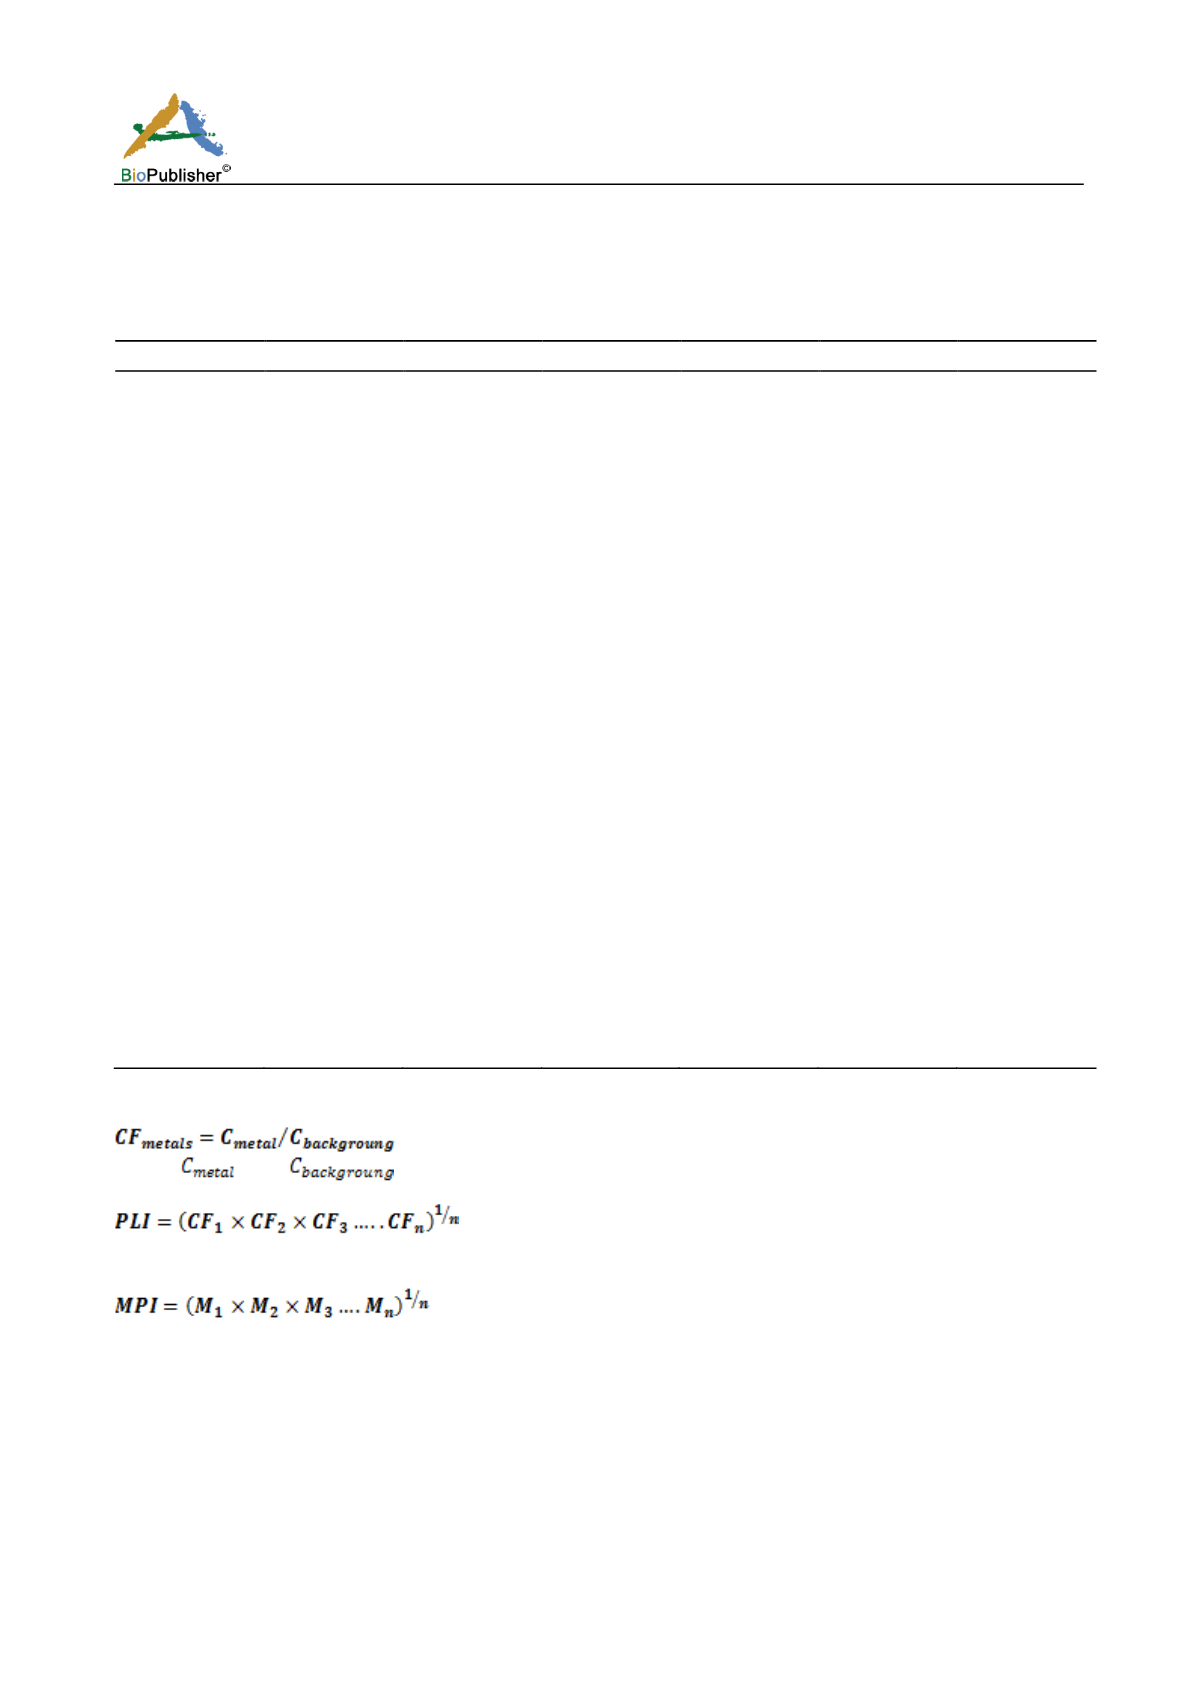
……………………………………
1
Where
and
are the metal concentration and the baseline metal concentration, respectively.
……………………………….
2
Where n and CF are the metal number and contamination factor, respectively.
………………………………… 3
Where n and M are the metal number and metal concentration, respectively.
The pollution level in different aquatic ecosystems was calculated using Pollution Load Index (PLI) (Tomlinson
et
al
., 1980; Chaudhuri
et al
., 2007; Nomaan
et al
., 2012; Shams El-Din
et al
., 2014 and Ali
et al
., 2016). It
represents the number of times by which the heavy metal concentration in the samples exceeds the background
concentration, and gives a cumulative indication of the overall level of heavy metal toxicity in a specific site.
When the values of PLI are < 1, it suggests a low level of pollution, a value of one indicates the presence of only
baseline level of pollutants and values above one indicate progressive deterioration of the site and estuarine


