International Journal of Marine Science 2014, Vol.4, No.35
            
            
              http://ijms.biopublisher.ca
            
            
              5
            
            
              Table 2 Comparison between erosion and accretion profiles (W_R and E_B) and between erosion and accretion sites within the same
            
            
              profile (E_R, W_B, W_S and E_S) according to the averages of
            
            
              226
            
            
              Ra,
            
            
              232
            
            
              Th and
            
            
              40
            
            
              K concentrations (Bq/kg) of the main erosion and
            
            
              accretion sites within the profiles. west of Rosetta (W_R), East of Rosetta (E_R), West of El-Burullus (W_B), East of El-Burullus
            
            
              (E_B), West of Ras El-Bar (W_S) and East of Ras El-Bar (E_S) during 2008
            
            
              W_R
            
            
              E_B
            
            
              E_R
            
            
              W_B
            
            
              W_S
            
            
              E_S
            
            
              Erosion  Accretion Erosion  Accretion Erosion  Accretion Erosion  Accretion Erosion  Accretion
            
            
              226
            
            
              Ra 31.17
            
            
              >
            
            
              18.13
            
            
              14.75
            
            
              <
            
            
              23.68
            
            
              28.00
            
            
              >
            
            
              17.67
            
            
              37.92
            
            
              >
            
            
              23.67
            
            
              23.75
            
            
              >
            
            
              18.83
            
            
              232
            
            
              Th 30.44
            
            
              >
            
            
              18.80
            
            
              23.85
            
            
              >
            
            
              20.50
            
            
              20.55
            
            
              >
            
            
              20.30
            
            
              41.60
            
            
              >
            
            
              27.92
            
            
              27.97
            
            
              >
            
            
              18.48
            
            
              40
            
            
              K 240.48
            
            
              <
            
            
              298.34
            
            
              284.20
            
            
              >
            
            
              170.25 358.25
            
            
              >
            
            
              329.70
            
            
              202.75
            
            
              <
            
            
              230.95
            
            
              337.85
            
            
              <
            
            
              340.25
            
            
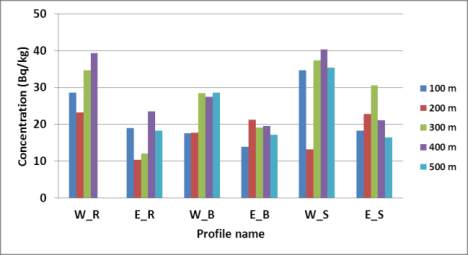
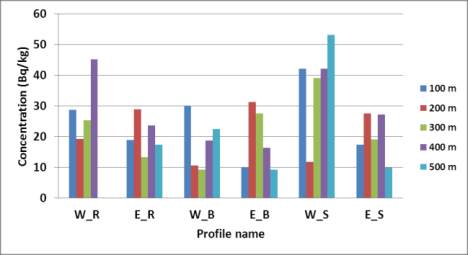
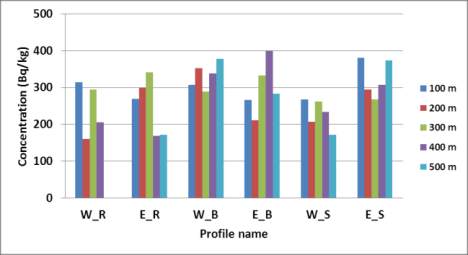
              Figure 2 Average concentrations values (Bq/kg) of
            
            
              226
            
            
              Ra (A),
            
            
              232
            
            
              Th (B) and
            
            
              40
            
            
              K (C) at different distances along the Nile Delta
            
            
              profiles.  W_R = West Rosetta, E_R = East Rosetta, W_B =
            
            
              West Burullus, E_B = East Burullus, W_S = West Ras El-Bar
            
            
              and E_S = East Ras El-Bar
            
            
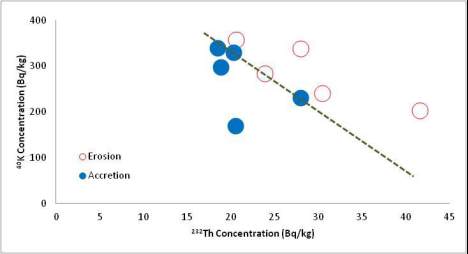
              Figure 3 shows the discrimination between the erosion
            
            
              and accretion sites according to their contents of
            
            
              232
            
            
              Th
            
            
              and
            
            
              40
            
            
              K. The dashed line in Figure 3 is differentiating
            
            
              them into two separate clusters. The erosion sites are
            
            
              Figure 3 Clustering of the average concentrations of
            
            
              232
            
            
              Th
            
            
              against
            
            
              40
            
            
              K in erosion and accretion sites at Nile Delta Profile
            
            
              sediments during 2008.
            
            
              characterized by relatively high
            
            
              232
            
            
              Th and relatively
            
            
              low
            
            
              40
            
            
              K concentrations and the reverse distribution
            
            
              occurred at accretion sites.
            
            
              The average Ra
            
            
              eq
            
            
              activity in Nile Delta coastal area
            
            
              was found to be 79.6±22.17 Bq/kg. The highest value
            
            
              was calculated as 124.46 Bq/kg at 500 m distance
            
            
              from west of Ras El-Bar profile, while the lowest
            
            
              value was calculated as 45.99 Bq/kg at 200 m distance
            
            
              at west of Ras El-Bar profile. The recommended
            
            
              maximum levels of radium equivalents for building
            
            
              materials to be used for homes are, 370 Bq/kg and for
            
            
              industries is 370–740 Bq/kg (UNSCEAR, 1982). All
            
            
              the materials examined are acceptable for use as
            
            
              building materials as defined by the Organization for
            
            
              Economic Cooperation and Development (OECD)
            
            
              criterion.
            
            
              The calculated outdoor gamma doses were listed in
            
            
              Table 1 with average value 37.25±9.58 nGy/h. The
            
            
              highest value was 55.64 nGy/h measured at 500 m
            
            
              distance from west of Ras El-Bar profile sediment,
            
            
              while the lowest dose value was 21.93 nGy/h
            
            
              measured at 200 m distance from west of Ras El-Bar
            
            
              A
            
            
              B
            
            
              C