International Journal of Marine Science 2014, Vol.4, No.27, 245-252
            
            
              http://ijms.biopublisher.ca
            
            
              251
            
            
              sustainability index value of fisheries resources
            
            
              management in the Thousand Islands and shows the
            
            
              difference of the average value of the two analyzes are
            
            
              very small (1.27%). This means that the MDS
            
            
              analyzes model was adequate to estimate the
            
            
              sustainability index value of the fisheries in the
            
            
              Thousand Islands. The differences small value
            
            
              indicates the error that has been made in the analysis
            
            
              process due to fault of score given and it can be
            
            
              minimized or avoid (Fauzi et al., 2005).
            
            
              Monte Carlo Analysis can also be used as simulation
            
            
              methods to evaluate the impact of random error in the
            
            
              statistic analysis conducted to the entirely dimension
            
            
              (Kavanagh and Pitcher, 2004). The result of MDS and
            
            
              Monte Carlo Analysis is shown on Table 2 .
            
            
              Table 2 Difference of sustainability index value of Rap-Insus in the Thousand Islands and the Monte Carlo analysis
            
            
              Dimension
            
            
              Sustainability Index Value (%)
            
            
              MDS
            
            
              Monte Carlo (MC)
            
            
              Difference (MDS-MC)
            
            
              Difference (MDS-MC)%
            
            
              Ecology
            
            
              48,63
            
            
              49,96
            
            
              1,33
            
            
              2,69
            
            
              Economy
            
            
              55,44
            
            
              55,03
            
            
              0,41
            
            
              0,74
            
            
              Social
            
            
              56,64
            
            
              55,73
            
            
              0,91
            
            
              1,60
            
            
              Legal and Institutional
            
            
              43,73
            
            
              44,28
            
            
              0,55
            
            
              1,25
            
            
              Infrastructure and Technology
            
            
              34,17
            
            
              34,21
            
            
              0,04
            
            
              0,11
            
            
              Average
            
            
              47,72
            
            
              47,84
            
            
              0,65
            
            
              1,27
            
            
              2.7 Test of accuracy
            
            
              The accuracy test of the MDS analysis (good and fit)
            
            
              obtained the coefficient of determination (R
            
            
              2
            
            
              ) between
            
            
              93.86% - 95.18% or bigger than 80% and it can be
            
            
              categorized as good and fit (Kavanagh, 2001). The
            
            
              stress value of 0.14 to 0.16, or the difference of stress
            
            
              value is at 0.02 and with this result the obtained MDS
            
            
              analysis has a high accuracy (good and fit) to assess
            
            
              fisheries sustainability index in the Thousand Islands
            
            
              (Fisheries, 1999). The stress value of determination
            
            
              Koefisien on Rap-Insus analysis Rap-Insus in the
            
            
              Thousand Islands is presented in Table 3.
            
            
              Table 3 Stress value and the value of determination (R
            
            
              2
            
            
              ) Rap-Insus result in the Thousand Islands
            
            
              No. Parameter
            
            
              Dimension of
            
            
              Ecology
            
            
              Dimension of
            
            
              economy
            
            
              Dimension Social
            
            
              Dimension Legal and
            
            
              D Institutional
            
            
              Dimensio Infrastructure
            
            
              and Technology
            
            
              1
            
            
              Value of Index
            
            
              48,63
            
            
              55,44
            
            
              56,64
            
            
              43,73
            
            
              34,17
            
            
              2
            
            
              Value of Stress
            
            
              0,142
            
            
              0,136
            
            
              0,134
            
            
              0,148
            
            
              0,135
            
            
              3
            
            
              Value of R
            
            
              2
            
            
              95,12
            
            
              95,45
            
            
              95,12
            
            
              94,85
            
            
              94,95
            
            
              4
            
            
              Number of Iteration 2
            
            
              2
            
            
              2
            
            
              2
            
            
              2
            
            
              3 Discussion
            
            
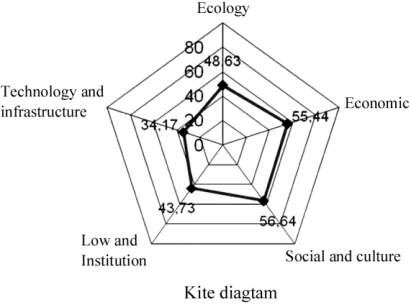
              Based on the analysis of the sustainability index value
            
            
              to the 5 dimensions that have been conducted, it can
            
            
              be illustrated by the kites diagram from fishery
            
            
              resources management in the Thousand Islands as
            
            
              Figure 12.
            
            
              Figure 12 shows legal and institutional, technology
            
            
              and infrastructure, and the ecology are less or not
            
            
              sustainable. The limitation of the fishermen on fishing
            
            
              rules and the low enforcement of society’s
            
            
              institutional role making the system of the use of
            
            
              fisheries resources management becomes over fishing.
            
            
              While the lack of transportation making the Thousand
            
            
              Island region isolated from other areas in Jakarta, and
            
            
              Figure 12 Kites Diagram layang-layang of the fishery resources
            
            
              management in the Thousand Islands based on RAPFISH
            
            
              analysis result