Basic HTML Version


International Journal of Marine Science 2014, Vol.4, No.23, 210-218
http://ijms.biopublisher.ca
213
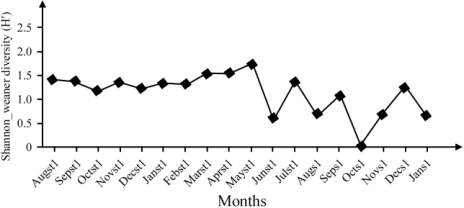
species diversity was observed in May, 2009 at station
1. As shown in the Figure 1, October shows zero
values in diversity indices. This clearly enlightens the
interruption of sampling due to heavy rain in that
month. None of the organisms were obtained except
dead shells and broken pieces of organisms.
Figure 1 Monthly variations of macrofaunal diversity at station 1,
Dharmadam beach
The low species diversity in the month of June 2009 at
station 1 was mainly due to the abundance of larvae of
Emerita holthuisi
(Figure 1). This may be due to high
reproductive periodicity of organism during this
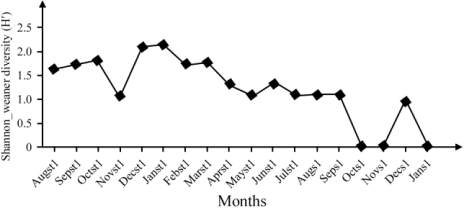
month. At station 2, in Dharmadam beach the highest
species diversity was observed in December, 2009 and
January 2010 (Figure 2). Species diversity is interrelated
with relative species abundance in a community
(Whittaker, 1965; Hulbert, 1971). The abundance of
tanaid and polychaete species in the study area
clearly showed the probability of less species
diversity of that area.
Figure 2 Monthly variations of macrofaunal diversity at station 2,
Dharmadam beach
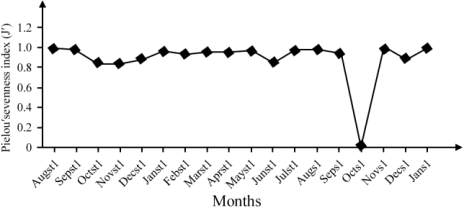
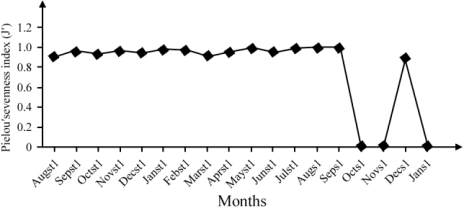
One or few species dominating a community shows
low evenness while those that have more even
distribution have a high evenness. The species
evenness observed in the Dharmadam beach agrees
with the statement (Figure 3 & 4). The distribution of
organisms was not even in monthly observations. The
overall community shows low species evenness.
Figure 3 Monthly variations of species evenness at station1
Figure 4 Monthly variations of species evenness at station 2
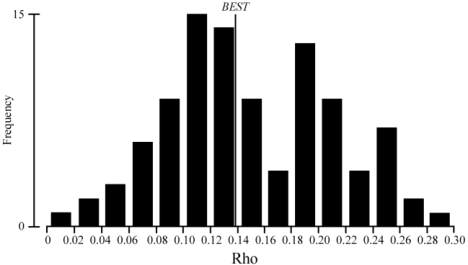
1.4 Faunal interactions based on statistical analysis
BEST analysis was carried out to check the influence
of water quality parameters on total groups collected
from the beach on monthly basis. The results showed
that the BEST correlation coefficient (Rho) for total
groups from Dharmadam beach was 0.139 (Figure 5,
Table 2). The variables are environmental parameters
and the selected variables for each parameter have
been displayed according to their SI No. (Table 2).
According to the BEST results, among the twelve
water quality parameters were analyzed from the
study area, six (salinity, nitrate, nitrite, conductivity,
total dissolved salts) showed significant correlations
with the fauna (Figure 6 & Table 2). The highest
significance has been shown by salinity.
Figure 5 Histogram showing the BEST results of total groups
(Rho 0.139)