International Journal of Marine Science, 2017, Vol.7, No.1, 1-7
3
Muscle samples were freeze dried, then sample was ground, and twenty five grams weighed was packed in a
thimble (Whatman) and desiccated overnight prior to extraction.
The desiccated thimble was extracted using Soxhlet apparatus with Methanol: Benzene solvent for 24 hours as the
methods described by (Grimalt and Oliver, 1993). The solvent was reduced and an aliquot was taken for lipid
estimation. Another aliquot was subjected to removal of other contaminants by passing the sample throw silica
gel-alumina column. The instrumental analysis of TPHs was carried with UV fluorescence, using Basrah crude oil
standard. Quantification was performed at 310 and 360 nm as excitation and emission wavelengths, respectively
(Moopam, 2005).
2 Results and Discussion
Information regarding species, the length, weight, Fat % and concentration of total petroleum hydrocarbons in the
selected commercial fish species
Luciobarbus
xanthopterus
,
Ctenophyngodon
idella
,
Cyprinus
carpio
,
Tilapia
zillii
,
Palaniza
abu
and
Leuciscus vorax
presented in Table 1 and Table 2.
Table 2 Levels (means ±SD) and average of TPH (μg/g dry wt.) during two seasons
Fish Species
Summer
Winter
Average
Luciobarbus xanthopterus
5.18±0.29
6.21±0.09
5.695
Ctenophyngodon idella
6.41±1.49
6.98±1.34
6.695
Cyprinus carpio
7.21±0.29
8.20 ±1.00
7.705
Tilapia zillii
2.47±0.33
3.10 ±0.20
2.785
Palaniza abu
3.43±0.35
4.05±0.95
3.74
Leuciscus vorax
21.52±3.41
5.12±0.32
13.32
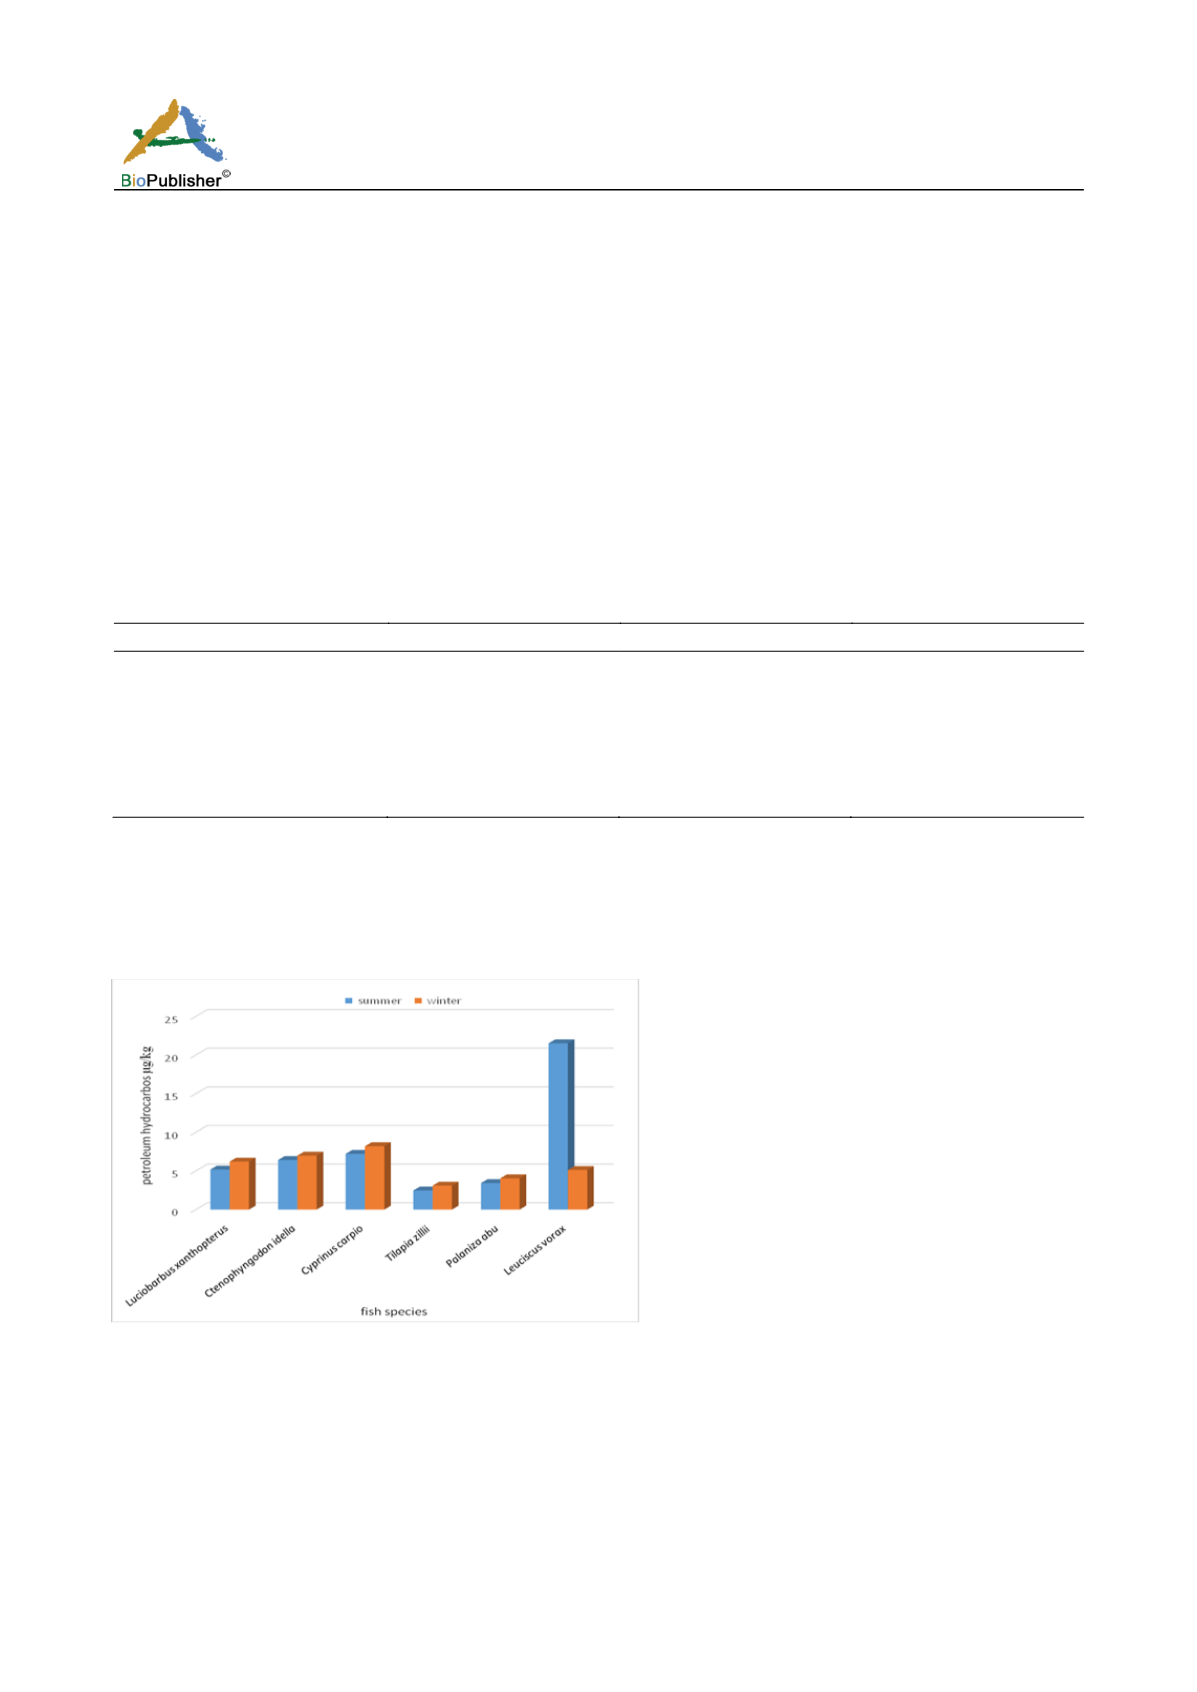
The result in Table 2 show variation in total petroleum hydrocarbons among six fish species which was the highest
in
Leuciscus vorax
in summer 21.52±3.41 μg/g (dry wt.) and the lowest in
Tilapia zillii
2.47±0.33 μg/g (dry wt.),
while in winter
Cyprinus
carpio
was 8.2±1.0 μg/g (dry wt.) more than other fishes and the low concentration was
found in
Tilapia zillii
too with level 2.47±0.33 μg/g (dry wt.). The mean of summer and winter is shown in Table 2
and Figure 1.
Figure 1 Petroleum hydrocarbon in fish species (μg/g dry wt.) from Shatt Al-Arab River in summer and winter (2014-2015)
The percentage levels of TPH in fish were high in
Leuciscus
vorax
33% and
Tilapia zillii
have 7% lower than other
fish. And according to the Figure 2 the fish ordering as the following:
Leuciscus vorax > Cyprinus
carpio >
Ctenophyngodon idella > Luciobarbus xanthopterus > Palaniza abu > Tilapia zillii
. This is may be due to the
variety of fish feeding habitat and the season of reproduction. It is very common that fish and other aquatic have
the ability to accumulation of petroleum products (Asuquo and Udoh, 2002).
The oil pollution of shatt Al-Arab due to the Industeral oil production activity and exploration and water Balance


