International Journal of Marine Science, 2017, Vol.7, No.7, 59-66
62
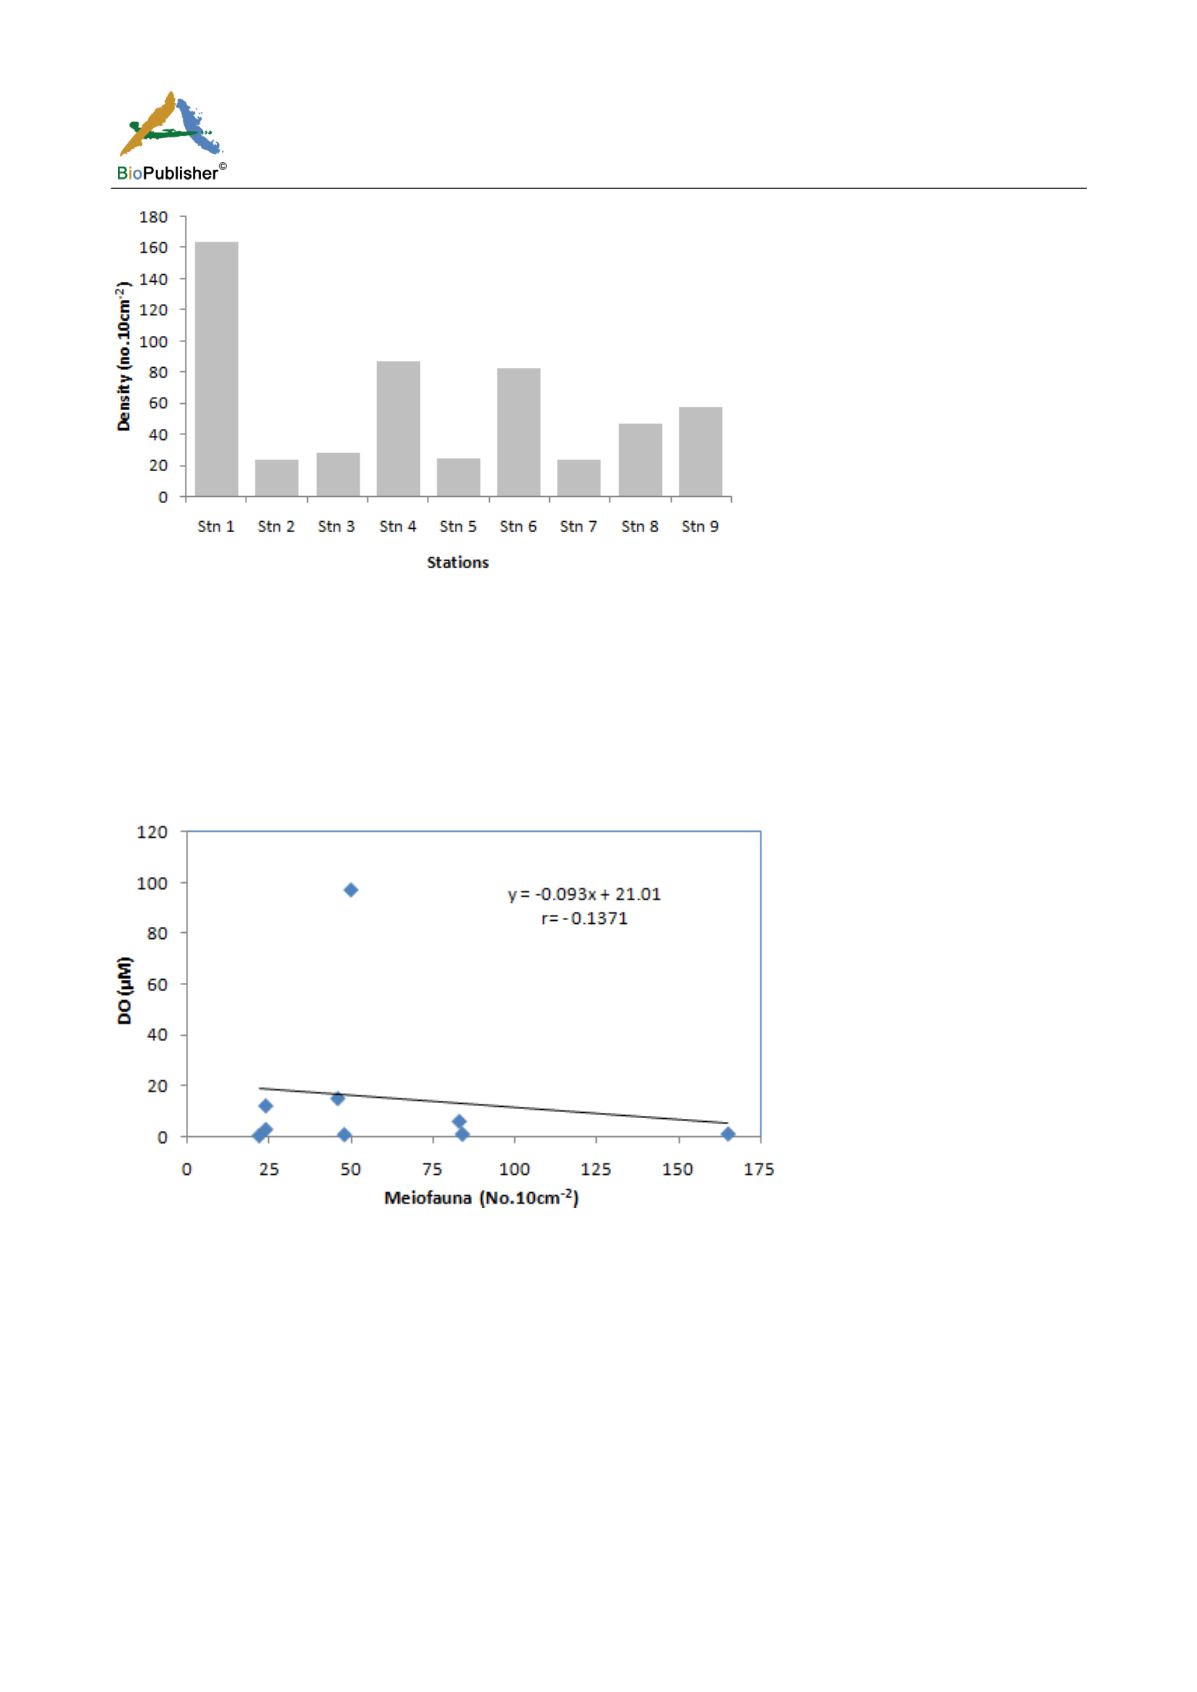
Figure 2 Total meiofaunal distribution in the study area
2.3 Vertical distribution
The vertical profile of the meiofaunal distribution in the sediment is given in Figure 3. More than 40% of the
metazoan meiofauna occurred in the 1 cm layer except at station 3 (700 m) where the top layer contained only
10%. Vertically the faunal abundance decreased with the increasing sediment depth. Nematoda was the most
dominant taxa recorded in the study area. They were vertically found throughout the sediment core from 0 to ~20
cm depth and contributed the maximum (35%-93%) to the total density at all the stations while the other groups
were restricted to upper few cm only (~10 cm depth).
Figure 3 Correlation between meiofauna and dissolved oxygen
The meiofauna progressively decreased with increasing depth in sediment. The pattern however, differed from
station to station. The 10-15 cm and 15-20 cm layer contained the least number and at some stations no fauna was
recorded at 15-20 cm. The maximum number of animals was recorded in the top 0-1 cm layer (10.7-60%). At
depth 650m where the oxygen was lowest (0.5 micromole) the total density recorded in the top 0-1 cm layer was
60.8.
2.4 Nematode feeding type
In the present study nematode feeding types varied with habitat (Table 2). The study area was dominated by a
non-selective deposit feeders (1B) and predators (2B) whereas proportions of selective deposit feeders (1A) and
predators (2A) were comparatively low at most stations (Table 3). The starting of OMZ was represented with
maximum contribution of epigrowth feeders (more than 35%). Second dominant feeding category was
non-selective feeder. This could be attributed to the presence of a high proportion of shell fragments and coarse


