International Journal of Marine Science 2017, Vol.7, No.40, 386-393
387
(total, standard and head lengths) in the blackspot snapper
L. ehrenbergii
collected from the Sea of Oman at the
coasts of Muscat City, Oman. These data are useful to researchers studying food habits of predator species, to
determine the size of prey from the length of recovered otoliths.
1 Materials and Methods
A total of 40
L. ehrenbergii
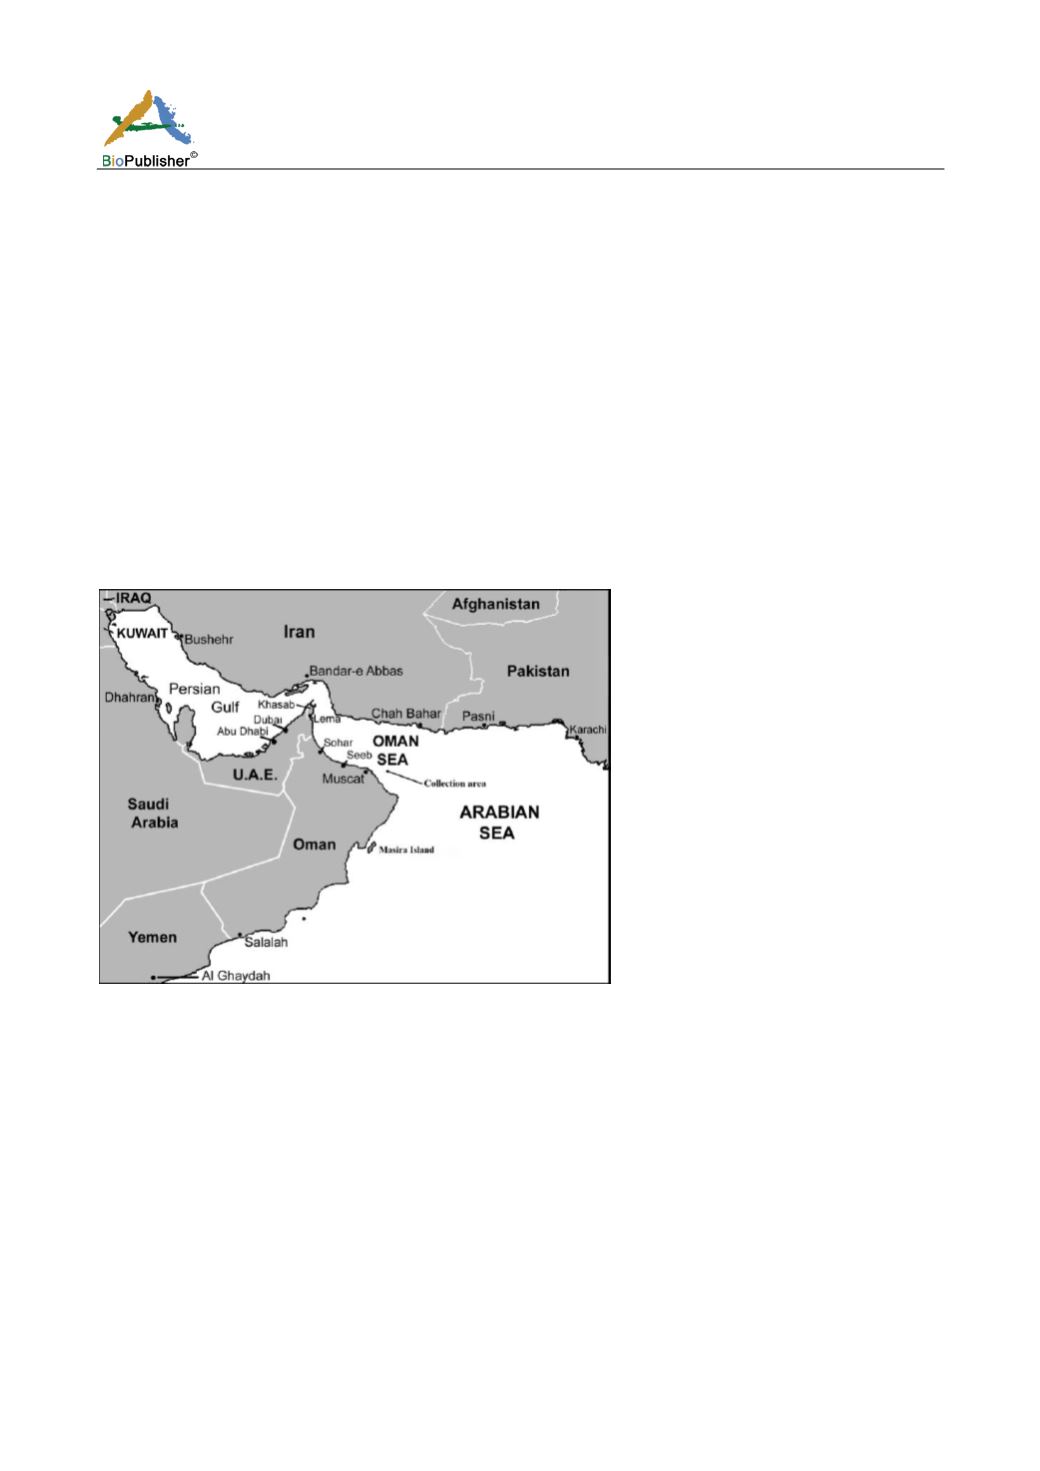
obtained between May and June of 2017 from the commercial bottom artisanal catch
operating at the waters of Muscat City, Oman (Figure 1). The collected specimens were measured for total length
(TL); standard length (SL) and head length (HL) using digital calipers sensitive to 0.1 mm. Otoliths (sagittae)
were removed, cleaned and stored dry in vials. Otolith major axis (length OL) and minor axis (width OW) were
measured to the nearest 0.1 mm using a dissection microscope provided with a micrometer
eyepiece. The
relationships between otolith dimensions and fish size and fish head length were calculated using the following
formula:
Y=a X
b
where Y= morphological characters, X= Fish total length, standard length or head length, a and
b
= constants.
According to the law of the allometry, “
b
” would take a value close to 1. To test this value, a Student test “t” was
used.
Figure 1 Map showing collection area
The relationships, otolith length (OL)-fish length (TL), otolith length (OL)-fish length (SL), otolith width
(OW)-fish length (TL), otolith width (OW)-fish length (SL), otolith length (OL)-fish head length (HL), and otolith
width (OW)-fish head length (HL).
The model with the highest coefficient of determination (R
2
) was chosen to describe the above-mentioned
relationships. Differences between coefficients of regressions generated separately for right and left otoliths were
tested by analysis of covariance (ANCOVA) (Zar, 1999). In case of equation coefficients did not disagree
statistically, a single regression was considered for each parameter using the mean of right and left otolith
measurements. An ANOVA F-test was used to test the significance of the slope of the regression (testing the null
hypothesis H0:
b
=0). The allometry was evaluated by testing the significance of the allometric coefficient “
b
”
(
b
=1,
b
<1 and
b
>1 for isometry, negative allometry and positive allometry respectively) that used as a measure for
the intensity of differential increase in the morphological characters relative to a specific reference length (Van
Snik et al., 1997). The regression equations between the total length and otolith length, total length and otolith
width, standard length and otolith length, standard length and otolith width, head length and otolith length, and


