International Journal of Horticulture, 2017, Vol.7, No. 12, 95-105
102
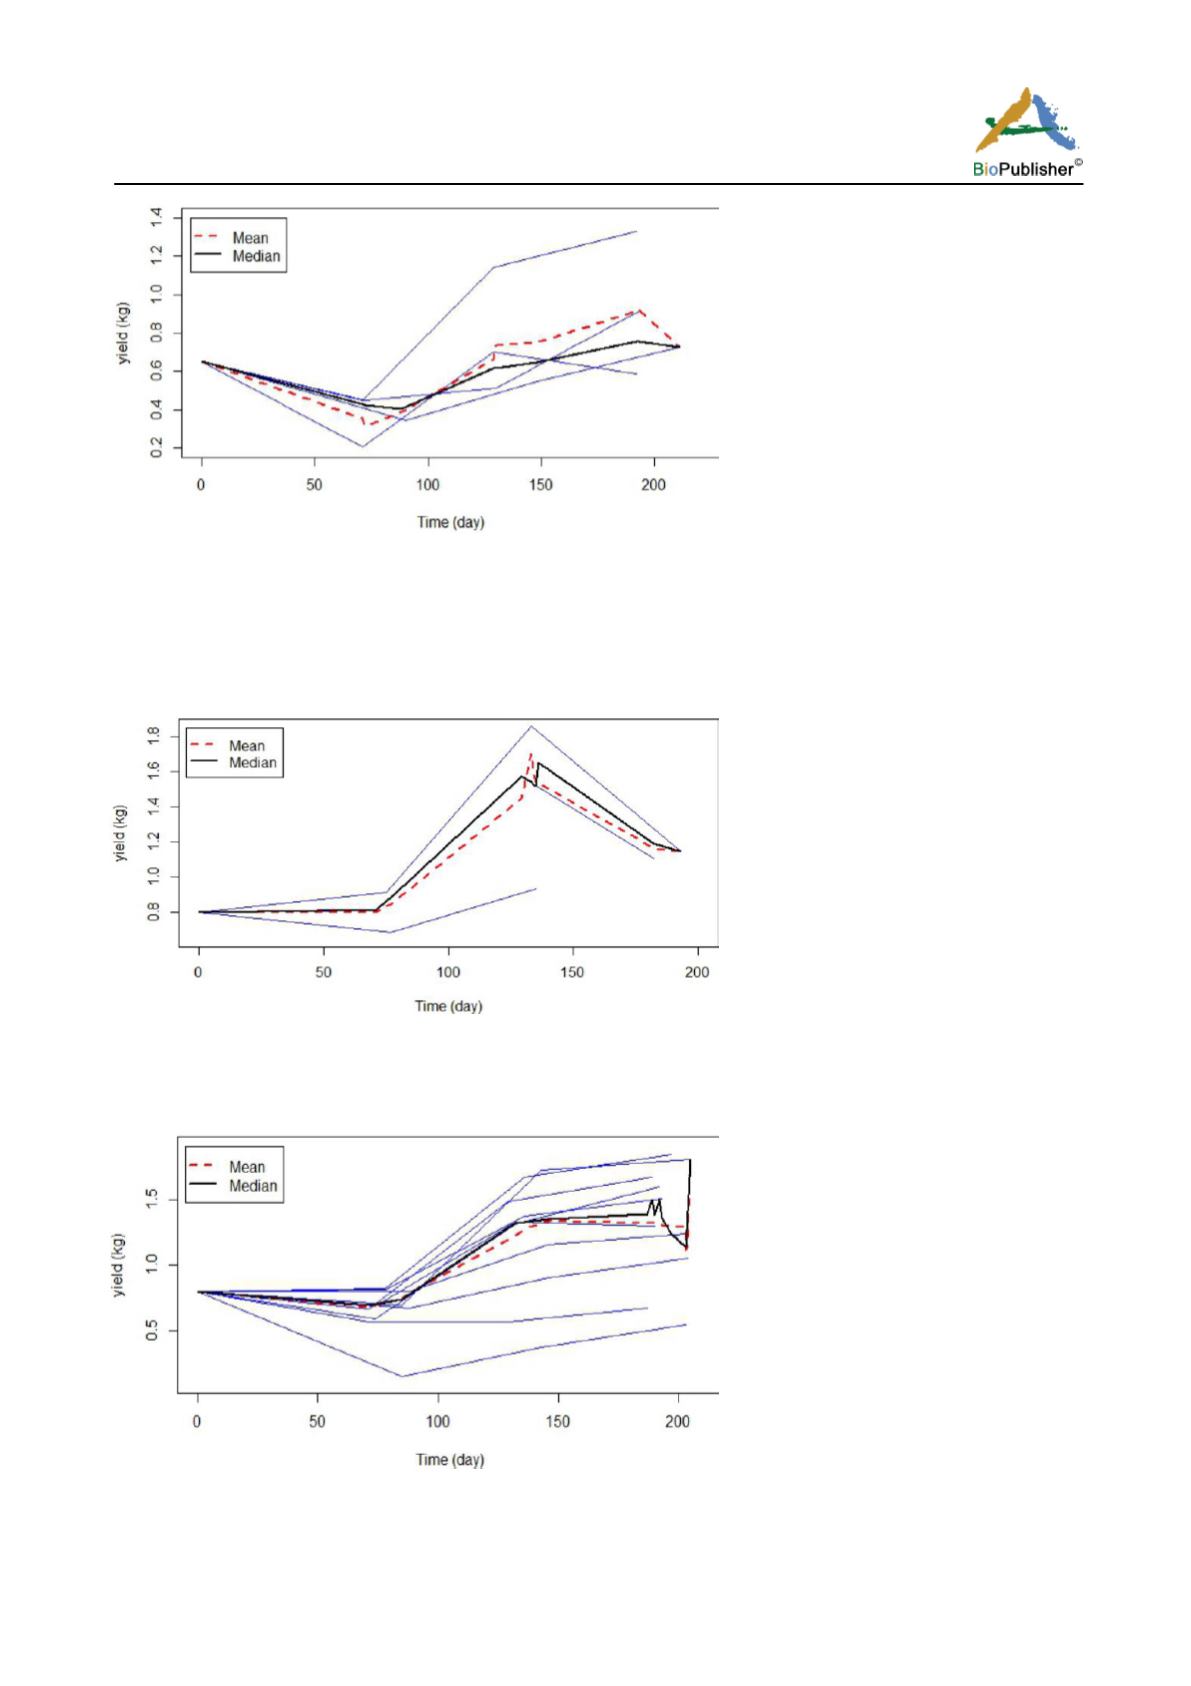
Figure 10 Growth curve of yam (seed wt. 650 g, undisturbed)
Note: Growth curve of yam with seed weight 650 g when the growth is undisturbed as underground yam is not detached during the
experiment is shown in Figure 10. The median curve is smoother compared to the mean response curve that has a high elevation due
to the growth curve on the top
In Figure 11, Figure 12, Figure 13, we consider seed weight 800 g in three different harvesting strategies, the
response curve in Figure 12 with second interim cut seems to be stable towards end.
Figure 11 Growth curve of yam (seed wt. 800 g, cut at 1
st
interim)
Note: Growth curve of yam with seed weight 800 g, when yam is detached at the time of first interim reading shows an upward
trend in the mean and median response curves. There is a sudden upturn in the response curves when the plant lifetime of the lower
curve terminates
Figure 12 Growth curve of yam (seed wt. 800 g, cut at 2
nd
interim)
Note: Growth curve of yam with seed weight 800 g, when yam is detached at the time of second interim reading shows an upward
trend in the mean and median response curves. The two response curves are close to each other and seem to reach stability after 150
days, if we ignore the last portion of the curves with scarcity of observations in that region


