International Journal of Aquaculture, 2018, Vol.8, No.15, 112-120
118
3.2 Changes in TVB-N during storage
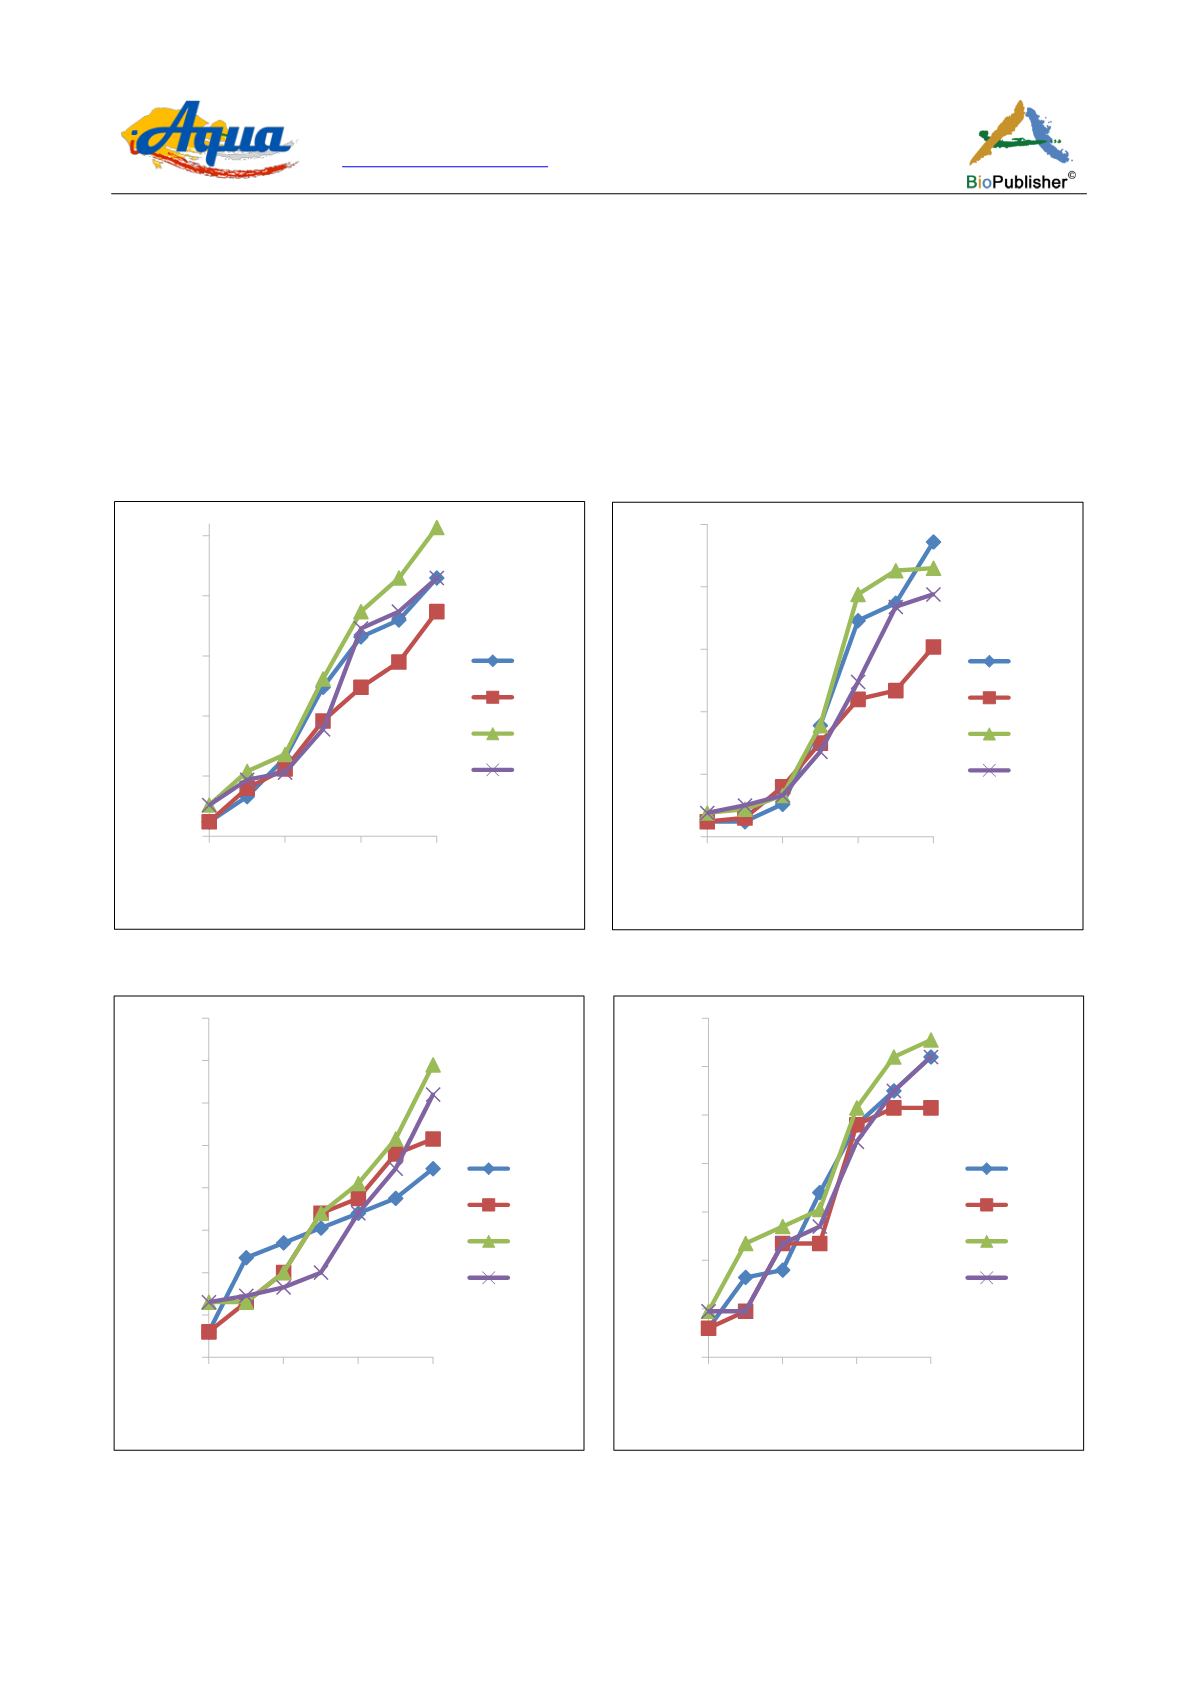
Figure 5, Figure 6, Figure 7 and Figure 8 present the changes in TVB-N during storage. TVB-N is one of the most
widely used parameter to evaluate fish quality (Pankyamma et al., 2017). TVB-N is present in very small quantity
in fresh fish and produced mainly by bacterial. TVB-N captures all the volatile Nitrogen containing compounds
during decomposition. After smoking, significant increases were observed in some of the samples. TVB-N values
increased significantly (
p
<0.05) in all the samples after the third week of storage. Towards the end of storage,
salted smoked samples generally had lower values than unsalted samples. This may be due to the preservative
effect of salt. Also, catfish generally had higher TVB-N, this may be as a result of the higher moisture contents.
There was steady increase in TVB-N in all the samples, this is a sign of deterioration. Drying of the fish samples
resulted in the reduction of TVB-N in most of the samples.
Figure 5 Changes in the TVB-N of smoked fishes during
storage (asejire)
Figure 6 Changes in the TVB-N of smoked fishes during storage
(opa)
Figure 7 Changes in the TVB-N of dried fishes during
storage (asejire)
Note: AMD1: Unsalted dried mango tilapia; AMD2: Salted
dried mango tilapia; ACD1: Unsalted dried catfish; ACD2:
Salted dried catfish
Figure 8 Changes in the TVB-N of dried fishes during storage
(opa)
Note: OMD1: Unsalted dried mango tilapia; OMD2: Salted
dried mango tilapia; OCD1: Unsalted dried catfish; OCD2:
Salted dried catfish
10
15
20
25
30
35
0
2
4
6
TVB-N (mg-N/100g)
Storage period (weeks)
AMS1
AMS2
ACS1
ACS2
10
15
20
25
30
35
0
2
4
6
TVB-N (mg-N/100g)
Storage period (weeks)
OMS1
0MS2
0CS1
0CS2
10
12
14
16
18
20
22
24
26
0
2
4
6
TVB-N (mg-N/100g)
Storage period (weeks)
AMD1
AMD2
ACD1
ACD2
10
12
14
16
18
20
22
24
0
2
4
6
TVB-N (mg-N/100g)
Storage period (weeks)
OMD1
OMD2
OCD1
OCD2


