International Journal of Aquaculture, 2017, Vol.7, No.25, 166-173
169
Table 1 Wavelengths use in measuring light absorbance for various metals at different lamp apertures and instrument used
Heavy metal
Cu
Cd
Cr
Fe
Mn
Ni
Pb
Zn
Ca
Mg
Wavelength (nm)
324.8
326.1
357.9
248.4
279.5
341.5
283.3
213.9
422.7
202.6
Lamp aperture (nm) 0.1
0.1
0.1
0.1
0.1
0.1
0.1
0.1
0.1
0.1
Instrument used
AAS
AAS
AAS
AAS
AAS
AAS
AAS
AAS
FP
FP
Note: AAS = Atomic absorption spectrophotometer; FP = Flame photometer
3 Results
Concentrations of metals in all tissues combined for a particular station were displayed in Table 2. Metals that
were different in their concentration among the stations included Manganese (Mn), Lead (Pb), Zinc (Zn) and
Calcium (Ca). Iron (Fe), Cadmium (Cd), copper (Cu) and Magnesium (Mg) were not significantly different in
concentration among stations. Means which carry the same letters were statistically the same while those with
different letters were statistically different.
Table 2 Show the mean values of the metals at the various stations in
Malletia cumingii
from Okpon River
Location
Fe
Mn
Pb
Cd
Cu
Zn
Ca
Mg
A Upper reaches
0.062
±0.014 a
0.066
±0.013b
0.00
±0.000c
0.043
±0.010a
`0.046
±0.011a
0.047
±0.016a
1.079
±0.088a
0.409
±1.107a
B Middle reaches
0.069
±0.012a
0.077
±0.012a
0.063
±0.009a
0.046
±0.014a
0.041
±0.012a
0.034
±0.014b
0.818
±0.051b
0.323
±0.130a
C Lower reaches
0.064
±0.008a
0.071
±0.010ab
0.071
±0.042b
0.042
±0.011a
0.045
±0.013a
0.028
±0.014b
0.870
±0.143b
0.339
±0.106a
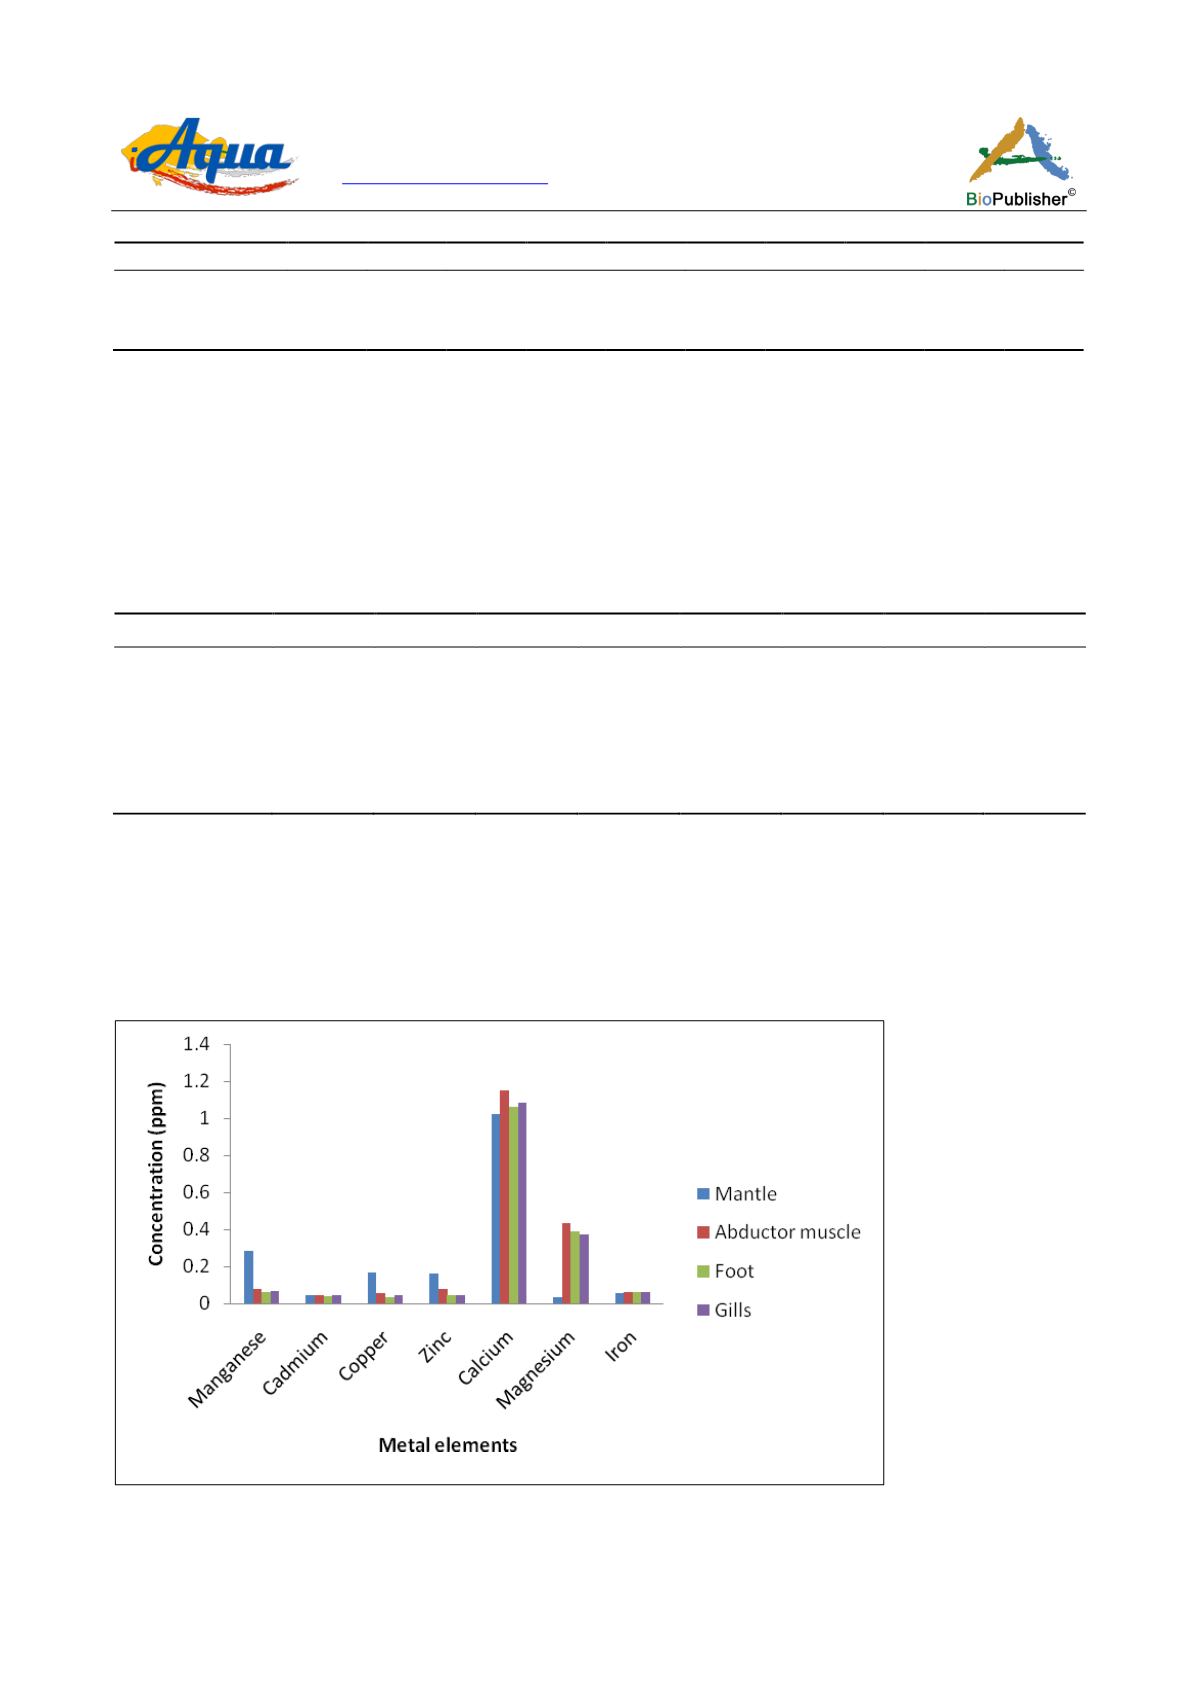
Figure 2; Figure 3; Figure 4 show the concentrations of the different elements in the various tissues namely mantle,
abductor muscle foot and gills in different stations. In Figure 2 it was observed that manganese had a high
absolute concentration value in the mantle compared to other elements. Manganese and zinc were comparatively
higher than other elements in the mantle in the different stations, while calcium was higher than other elements in
different tissues and stations. Figure 5 is a four axis graph which shows that calcium was the most highly
concentrated as it is furthest apart from the origin of the graph. This was followed by magnesium and manganese.
Figure 2 Metals elements concentrations in the tissues of
Malletia cumingii
in station A (Ekurri). All the elements were not
significantly different (α = 0.05) in concentration except Magnesium whose concentration was lower in the mantle compared to other
tissues. It is also observed that Calcium was higher than any other metal followed by Magnesium


