International Journal of Aquaculture, 2016, Vol.6, No.5, 1
-
14
10
Table 3 Spawning periods for some mullet species at different regions
Species
Regions
Spawning period
References
L. klunzingeri
Kuwaiti Waters
November - March
(Abou-Seedo and Stephen, 2004)
L. ramada
Lake Timsah, Egypt
November - January
(EL-Halafawy et al, 2007)
L. argentea
South - eastern Australia
January - March
(Kendall and Gray, 2008)
L. klunzingeri
Persian Gulf & Oman Sea
November - March
(Hakimelahi et al, 2011)
Mugil cephalus
Neretva Estuary (Croatia)
July - September
(Bartulović et al, 2011)
Mugil cephalus
Northern Coast (Senegal)
December - January
(Ndour et al, 2013)
L. carinata
Suez Bay, Egypt
During Autum
(El-Ganainy et al, 2014)
Liza subviridis
Indian water
September - October and
February - March
(Rahman et al, 2015)
Mugil cephalus
Viskhapatnam coast
late October to December (Thulasi and Lakshmi, 2016)
L. carinata
Suez Bay, Egypt
November - March
Present study
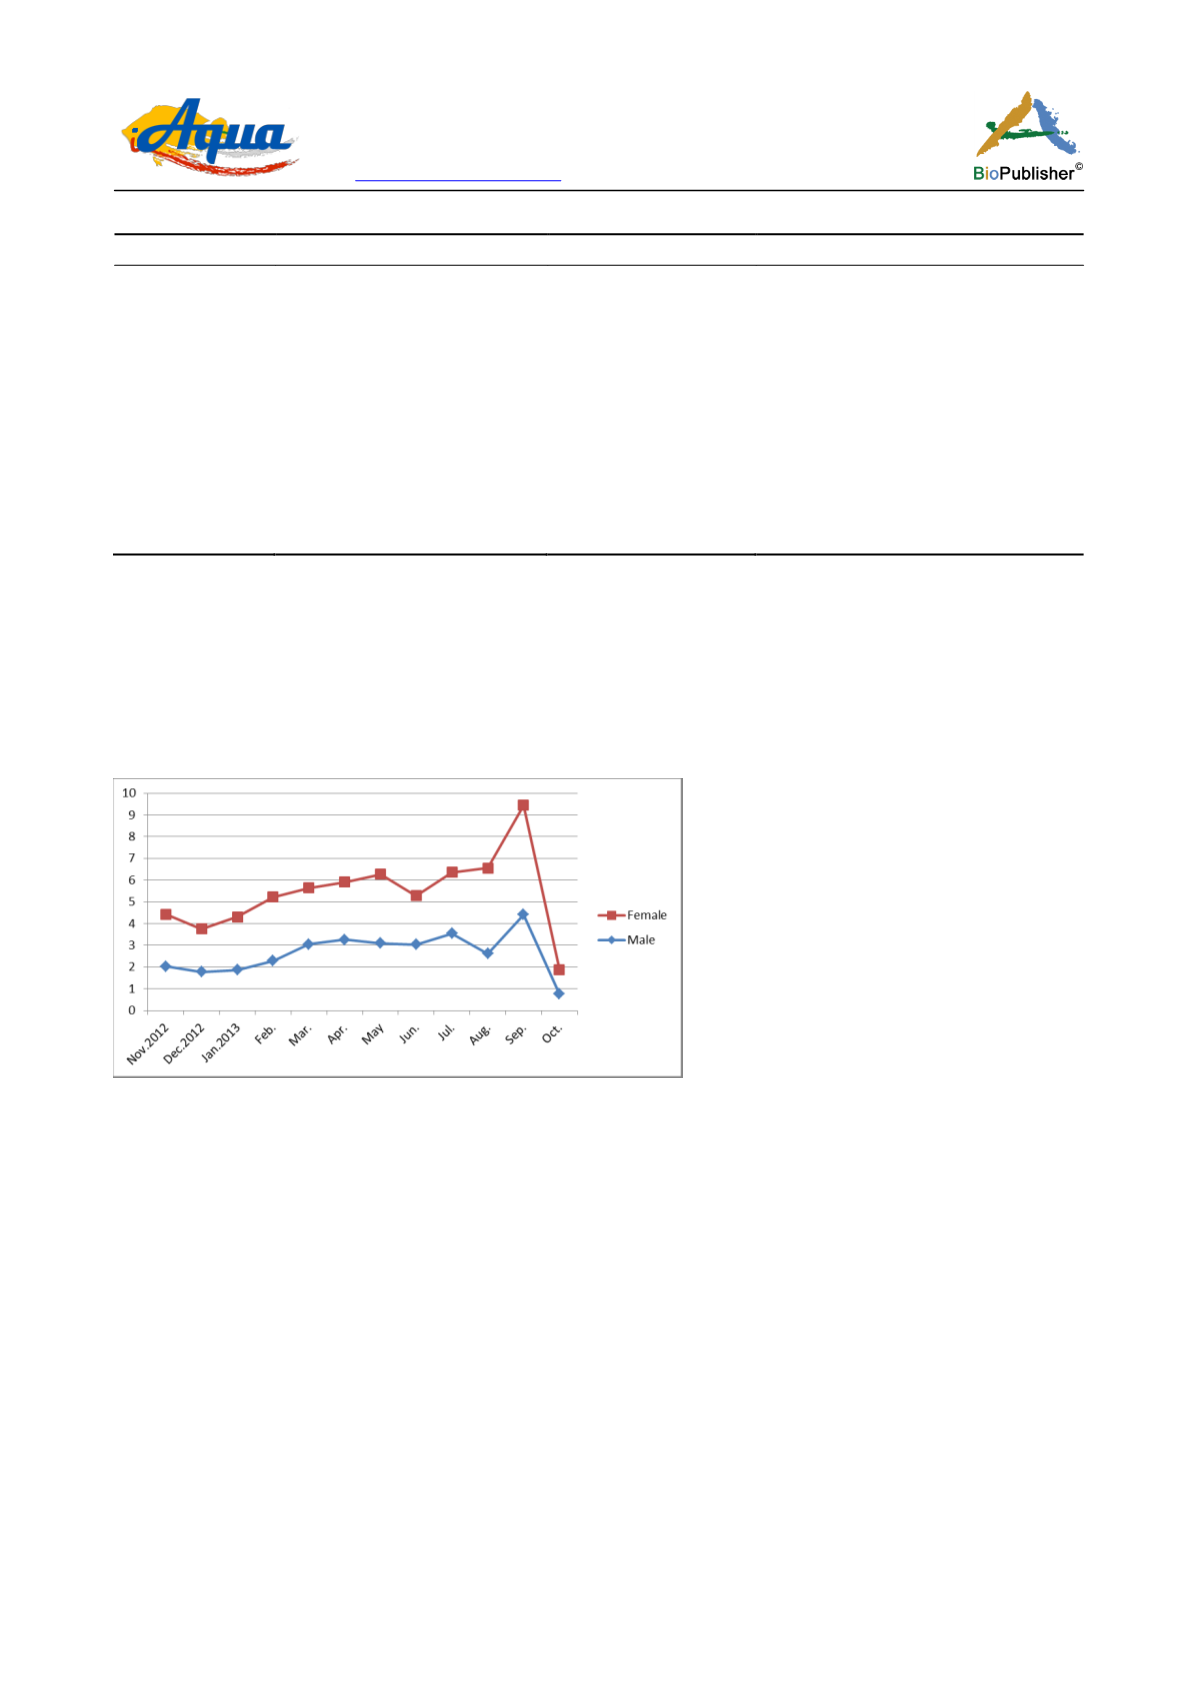
3.8 Hepato - somatic index (HSI)
HSI fluctuated during the study period, males and females were parallel to each other, showing liver activity
increased in the months of May to the highest peak in September (4.414 ±0.389 and 5.034 ±0.338) for (males and
females) respectively (Figure 11), HSI decreased during the spawning period to reach the low level during this
period at the peaked GSI month in December (1.781 ± 0.167 and 1.977 ± 0.093) for (males and females)
respectively, due to consuming the fish the stored energy in the liver because of stopping feeding in this period
due to reproduction.
Figure 11 Monthly variation in hepato-somatic index of males and females of
L. carinata
in Suez Bay
In the present study the recorded values of HSI decreased during the spawning period and this is in agreement
with which recorded by (Abou - Seedo and Stephen. 2004 and Hakimelahi et al., 2011) for the same species. In
contrast (Albieri and Araújo, 2010) reported the highest value of HSI in the reproductive period for
M. liza
in
tropical Brazilian bay, and illustrated that due to accumulate large lipid deposit, primary triacylglycerols, which
are subsequently mobilized to support gonad development causing increase of liver mass during the reproductive
period, and decreased at the end of this period.
3.9 Fecundity
The size and weight of ripe females examined for fecundity estimation ranged from 14 cm to 18.3 cm TL and total
weight ranged from 31.55 g to 75.22 g respectively. The number of eggs for all the broods examined ranged from
24 500 to 115 258 oocytes. The overall mean fecundity obtained by direct summation procedure for the fish
population was 63.896 oocytes per fish.
The relationship of fecundity with fish total length and body weight were found to be linear and increasing with
increasing fish length and body weight (Figure 12). Fecundity correlated more with the body length than body
weight. Fecundity increases with body length, a relationship described by the equation.


