International Journal of Aquaculture, 2016, Vol.6, No.10, 1
-
9
3
LC136 883), and isolate C -1 showed high similarity (99%) to
Bacillus
sp strain WR -2 (acc. nb. KU159 243).
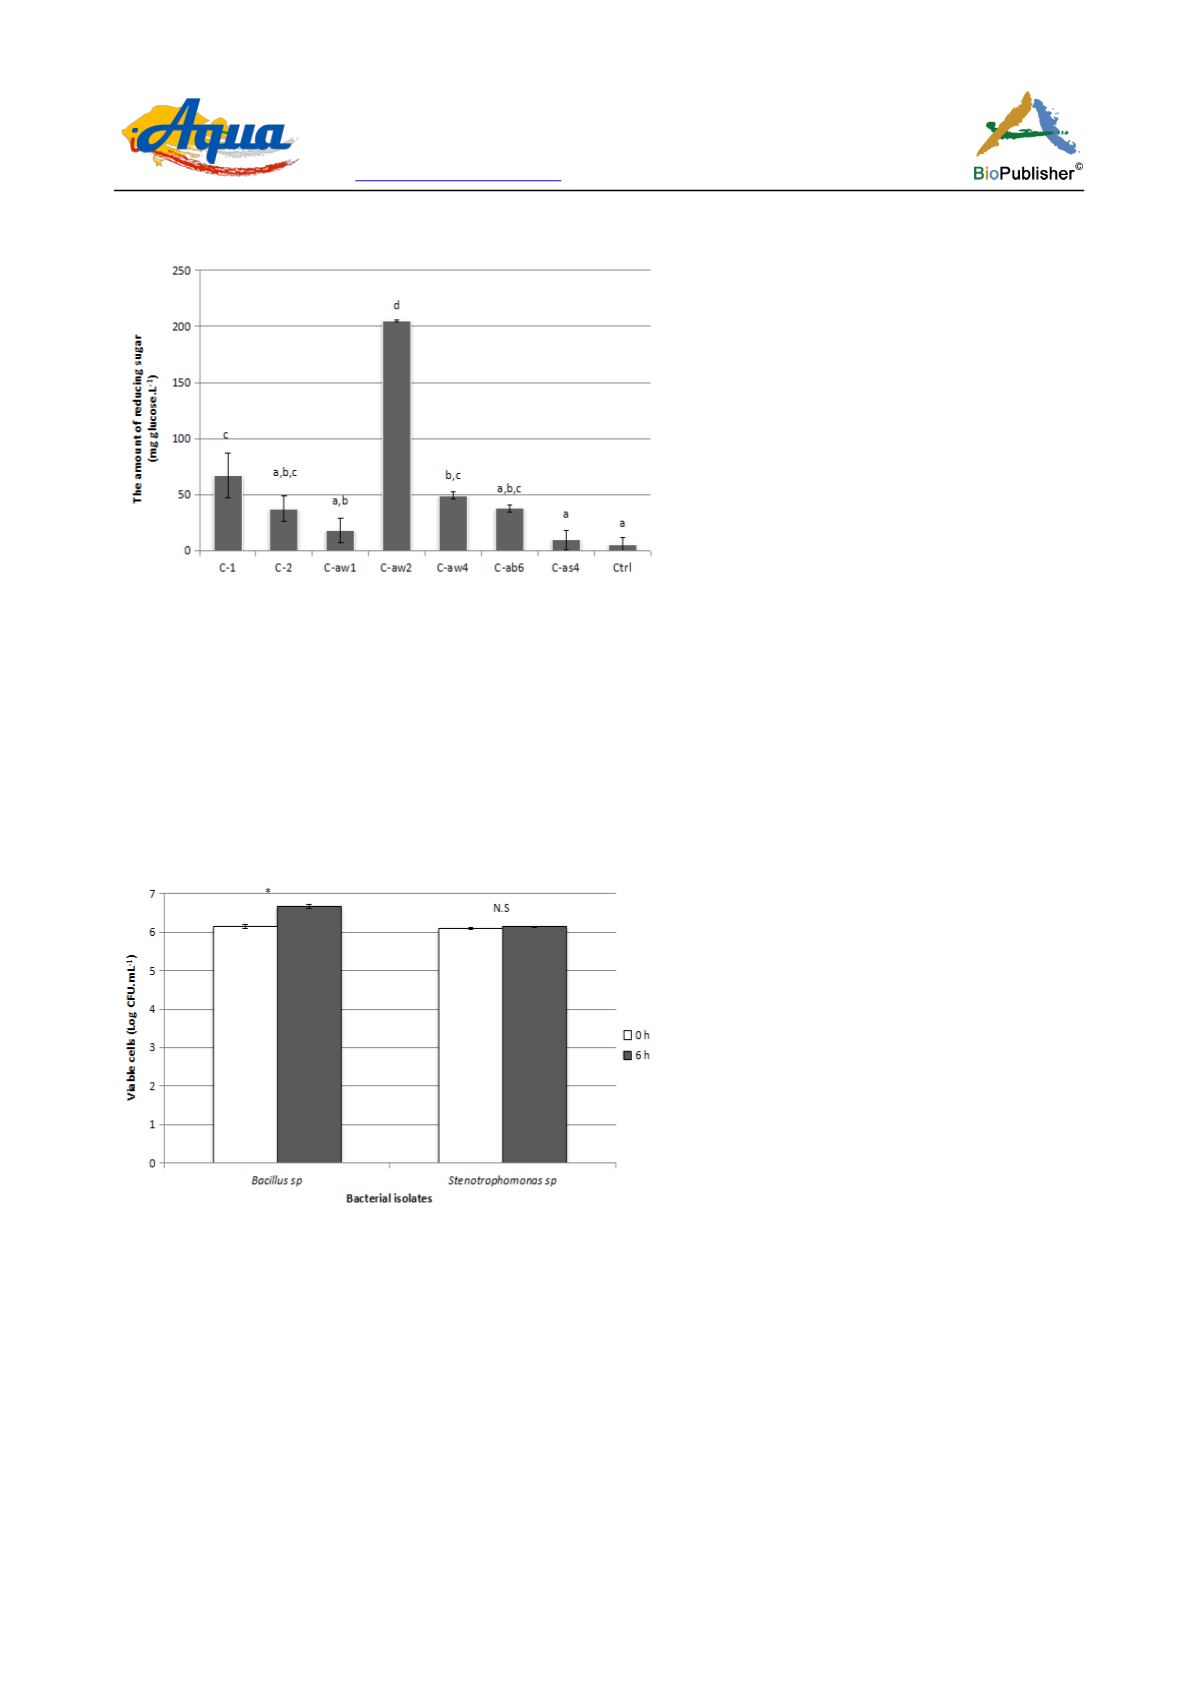
Figure 2 The amount of reducing sugars detected from seven bacteria with cellulolytic activity
Note: Values are the average of glucose concentration with standard deviation of 3 replicates. Different latters indicated there were
significant differences, p<0.05. C-1, C-2, C-aw1, C-aw2, C-ab6, C-as4 are bacterial isolates, and Ctrl is control
1.3 Survival in seawater
Both
Stenotrophomonas
sp and
Bacillus
sp had high survival rate after 6 h exposure in seawater (32 ppt) (Figure
3).
In fact,
Bacillus
sp was able to grow in the seawater, indicated by the increasing number of viable cells after
the 6 h exposure, from 6.15 at 0 h to 6.67 Log (CFU. mL
-1
) after 6 h, t =13.3, df 1, p =0.006. Meanwhile, there
was no significant difference in the average number of viable cells for
Stenotrophomonas
sp at 0 h and after 6 h
exposure into seawater, t =1.74, df 1, p = 0.33.
Figure 3 The change of viable cells of
Stenotrophomonas
sp and
Bacillus
sp at 0 h and after 6 h exposure in 32 ppt seawater
Note: The bars are the average numbers of viable cells with standard deviations of two replicates. N.S is no significant difference, p >
0.05. ** represents significant difference in the number of viable cells at 0 h and after 6 h exposure, p < 0.01
1.4 Survival in simulated stomach condition
Both bacterial isolates showed high survival rate in the simulated stomach environment (Figure 4), indicated by
no significant difference in the number of viable cells (Log CFU. mL
-1
) at 0 h and after 3 h incubation. Viable
cells of
Stenopthromonas
sp were recorded to be 6.04 at 0 h and became 6.03 after 3 h incubation, which was no
statistically different, t= 0.33, df 1, p =0.79. Meanwhile, the number of viable cells of
Bacillus
sp was
significantly higher at 3 h (7.12) after exposure compared to 0 h (6.54), which may also indicate the capacity of
this bacterial isolate to grow in the simulated stomach environment, t =206.9, df 1, p <0.01.


