Basic HTML Version


International Journal of Aquaculture, 2014, Vol.4, No.09 55
-
63
http://ija.sophiapublisher.com
58
1.9 Determination of DNApurity and concentration
The concentration and purity of extracted DNA
samples
were determined from the ratio of absorbance at A
260
and
A
280
(absorbance at 260 nm and 280 nm) using
a spectrophotometer against NaOH blank cuvette.
DNA sample containing cuvette was washed
properly before loading next sample. Thus, a list of
data for the samples for two different absorbencies was
found and saved. The protocol used in this experiment
was designed for a double-beam spectrophotometer.
The DNA concentration and purity was determined
by the following formulas:
1. Double-stranded DNA concentration (C), µg/ml =
Absorbance at A
260
×50 ×500
2. Purity = Absorbance at A
260
/Absorbance at A
280
In case of all the extracted DNA samples, A
260
/A
280
values were <1 which indicates satisfying purity of
the extracted DNA and there was no contamination.
After determining the concentrations of extracted
DNA, nuclease free de-ionized sterile distilled
water was added in a required volume to adjust the
concentrations of all the extracted DNA samples.
The adjusted DNA concentration for PCR
amplification was at 20-25 ng/µL.
1.10 PCR Amplification
The PCR reactions were performed in a 20µL reaction
mixture containing 1µL DNA sample (template DNA),
2µL (10 pico-mole/µL) oligonucleotide primers
(Bioneer, Korea), 2µL 10X reaction buffer (Bioneer,
Korea), 2µL 10mM dNTPs mixture (Bioneer, Korea),
2µL Taq DNA polymerase (1 unit) and 11µL de-ionized
sterile distilled water. The reaction mixtures were then
placed in a DNA thermal cycler (C1000
TM
, BIO-RAD,
USA) for polymerase chain reaction. The PCR
conditions for target DNA amplification were: initial
extended step of de-naturation at 94
℃
for 2 minutes
followed by 35 cycles of de-naturation at 94
℃
for 1
minute, primer annealing at 32-34
℃
for 1 minute and
elongation at 72
℃
for 1 minute.
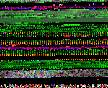
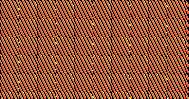
1.11 Agarose gel electrophoresis
After the completion of thermal cycling, 8 µL of each
PCR products was analyzed electrophoretically by
running through a 2% agarose gel and the amplified
product size was determined by comparing with a 100 bp
DNA size marker which is known as DNA Ladder
(Bioneer, Korea). The 2% agarose gel constituted
ethidium bromide and 1X TAE buffer. The
electrophoresis apparatus (Bioneer, A-7020, Korea) 1X
TAE buffer was poured to soak the agarose gel and the
elcetrophoresis process was maintained at 120 V
electric power for 45 minutes. The DNA Ladder
provided 13 different bands of 100 to 2000 base pairs
(100, 200, 300, 400, 500, 600, 700, 800, 900, 1000,
1200, 1600 and 2000 base pairs). The bands were
observed on UV-transilluminator and photograph was
taken by a Gel Cam Polaroid camera.
1.12 Data Analysis
DNA banding patterns generated by RAPD were
scored as 1 for bright bands (presence of bands) and 0
for their absence of bands. POPGENE (Version 1.31)
software was used to determine gene diversity (Nei,
1973), gene flow (N
m
), genetic distance (D), to
construct an unweighted pair group method of
arithmetic mean (UPGMA) dendrogram among the
populations and to perform a test of homogeneity (at
95% confidence interval) in different locus between
population pairs. Tools for population genetic analyses
(TFPGA; Miller, 1997) software was used to estimate
the population differentiation (F
ST
) at 5% level of
significance. In this study, similarity coefficient was
calculated across all possible pair wise comparison of
individuals both within and among the sex ratios using
the method of Lynch (1990) with the formula:
SI=2N
AB
/ (N
A
+N
B
)
Where, N
AB
= Number of fragments shared by
individual A and B; N
A
and N
B
=Number of fragments
scored for each individuals.
2 Results
A total of 80 prawn PL samples (four different
experimental groups: 3 treatments for 3 different sex
ratios
viz.,
1♂: 2♀, 1♂: 1♀, 2♂: 1♀ and the control
constitutes the PLs obtained from natural broods)
were used for RAPD analysis with the aid of 5
different oligonucleotide primers. The primers yielded
88 distinct bands of which 36 (41%) were
polymorphic. Primer OPA
3
generated the highest
numbers of bands (21 bands) whereas OPA
1
and OPA
4
produced the lowest number of bands (15 bands for
each). The primers OPA
9
and OPA
10
generated 20 and
17 bands respectively. The banding patterns have been
presented in the Figures 1-5.