Genomics and Applied Biology 2018, Vol.9, No.5, 24-31
27
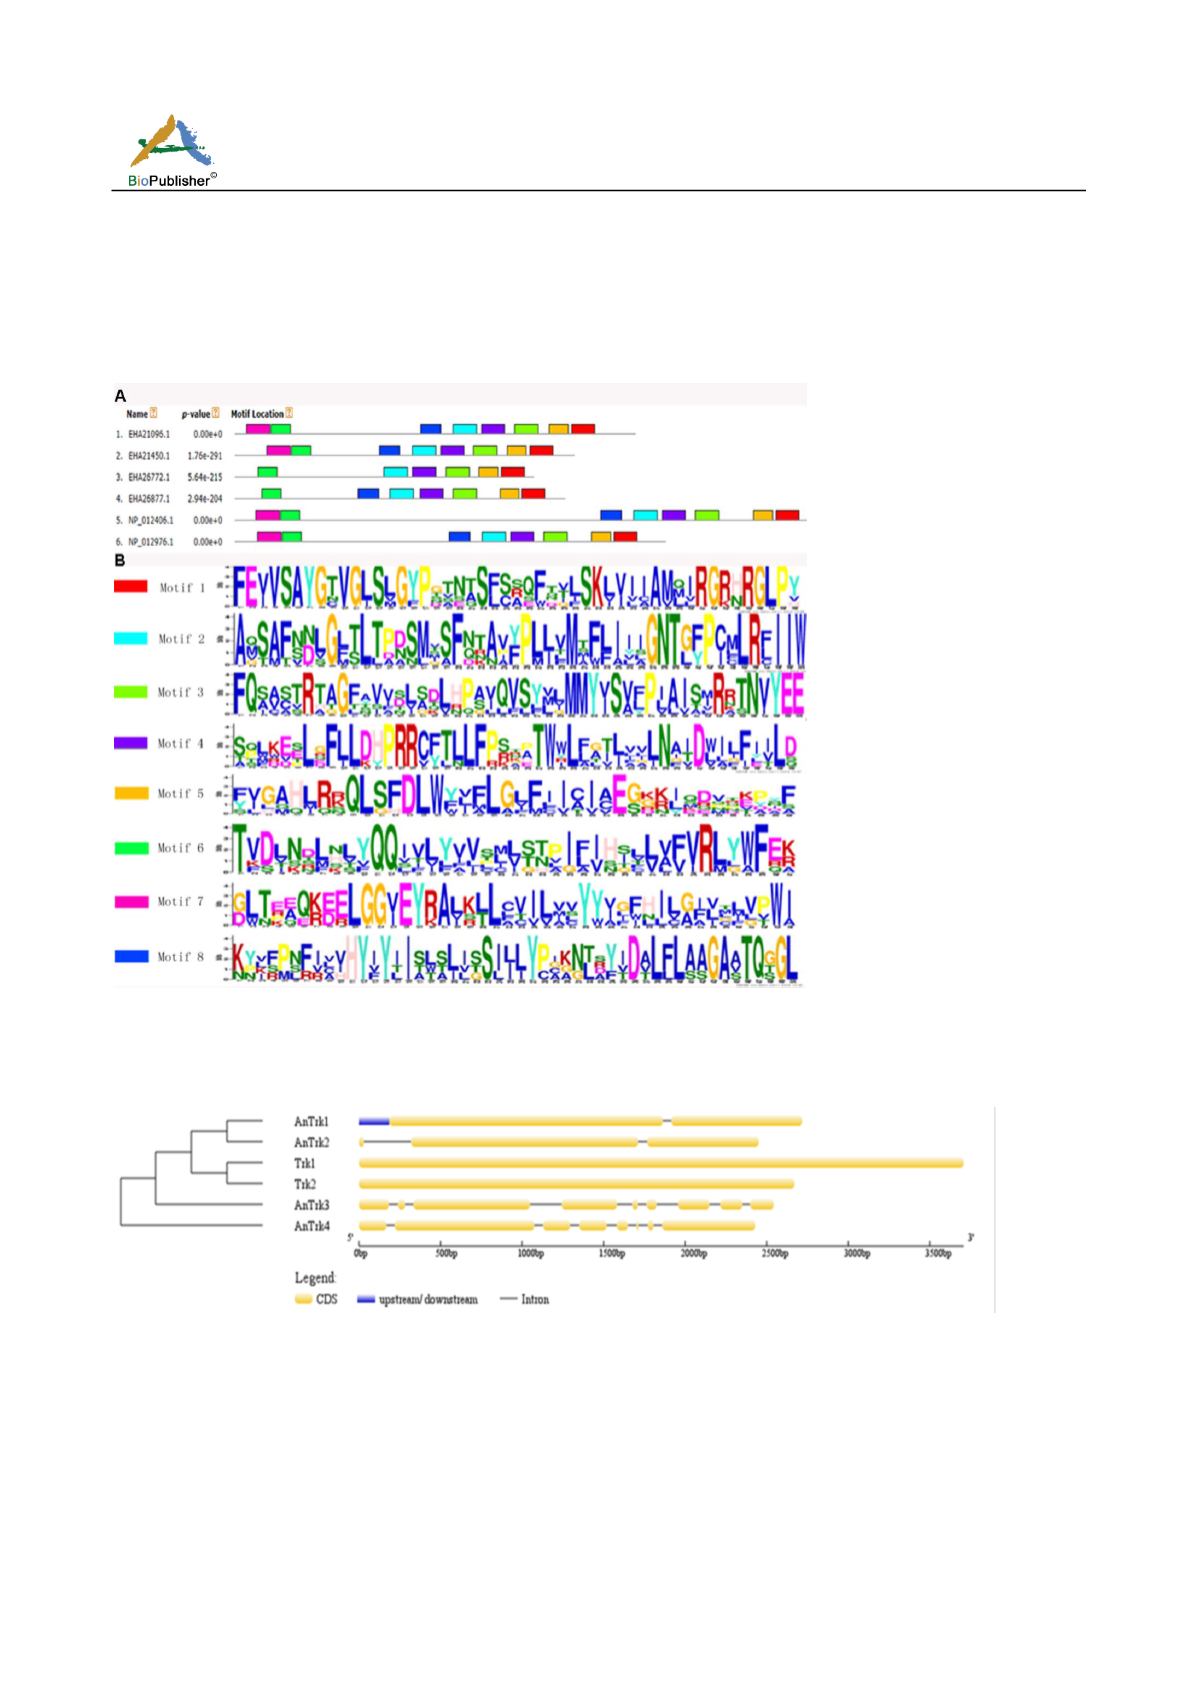
1.5 Gene Structure Analysis of Gene Family
To further investigate the characteristics of the
TRK
genes, GSDS2.0 was used to analyze the intron, exon, and
UTR regions of each gene (Figure 3). The result shows that the TRK genes in yeast do not contain intron, while
the
TRK
gene family members in
Aspergillus niger
have intron structure in which
AnTrk1
contain an intron and a
UTR sequence is presented at the 5’ end. In addition,
AnTrk2
,
AnTrk3
and
AnTrk4
contained two, eight and seven
introns, respectively.
Figure 2 Motif analysis of
TRK
gene family in
Aspergillus niger
Note: A: 1~4 represents AnTrk1, AnTrk2, AnTrk3 and AnTrk4, 5~6 represents Trk1 and Trk2; B: Eight conserved functional amino
acid residues in each P-loop are shown from top to bottom. Height of letter displays relative frequency of each amino acid residue;
Abscissa and ordinate demonstrate the number of amino acid residues and relative frequency of each amino acid residue, respectively
Figure 3 The analysis of gene structure for TRK family
Note: The coding sequences were represented in yellow. The upstream and downstream were represented in blue. The introns were
represented by black gray lines
1.6 Protein interaction analysis
Analysis of protein interaction network for the
TRK
genes reveals that there is an interaction between
TRK1
and
TRK2
, which forms a potassium transport system. This system can interact with the glucose transporters HXT3
and HXT1, the serine/threonine phosphatases PPZ1 and PPZ2, the phophoroyl cysteine decarboxylase SIS2, the
K
+
/H
+
antiporter KHA1 and the histone deacetylase RPD3 protein to regulate the osmotic balance of the cells
(Figure 4). However, the function and mechanism of
AnTRK3
and
AnTRK4
have not been reported yet, and the
interaction of the two members needs further experiments to identify.


