基本HTML版本


Computational Molecular Biology 2014, Vol. 4, No. 11 1-13
http://cmb.biopublisher.ca
4
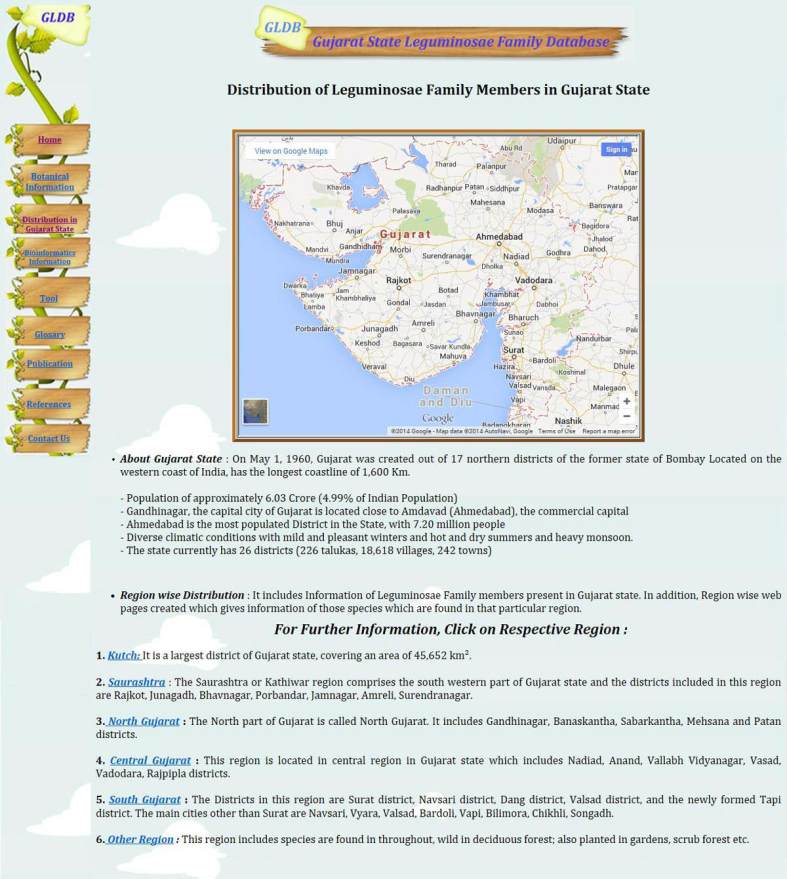
User has to click on Distribution in Gujarat state option
on left side in GLDB database. In addition this data are
developed by using Bioinformatics approach, so that user
will also get location of each region in Google map, as
per choice and after click on respective species it will
show species’ full description. Figure 4 is Home Page
which shows information of Gujarat State and
Leguminosae Family with region wise distribution.
Figure 4 Home Page of Gujarat State and Leguminosae Family with region wise distribution
Figure 5 is the information of Kutch region and if user
click on any species then it will show result page as
shown in Figure 6.
2.3 Data and Analysis of Leguminosae Family
This Section introduces Bioinformatics data analysis
of Leguminosae family species by tools and data
analysis (Figure 7).
One tool called “Leguminobase Tool” developed to
get information like DNA, PROTEIN, Genome etc of
each Leguminosae family species which are found in
Gujarat state.
One tool called “ConSeq Tool” also developed to find
out any conserved sequence found in submitted
sequence.