Basic HTML Version


Molecular Plant Breeding Provisional Publishing
Molecular Plant Breeding 2012, Vol.3, No.
6
, 57
-
62
http://mpb.sophiapublisher.com
58
single copy of the recombined
glg
B, and the other 9
with double copies of the recombined
glg
B, as shown
in Figure 4B.
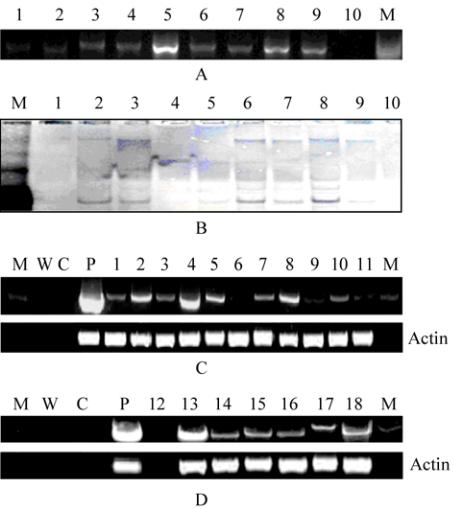
RT-PCR result with RNA of the 18 transgenic lines and
glg
B specific primers showed that
glg
B mRNA was
expressed in all of 15 transgenic lines. The expression
amounts in 4 transgenic lines were much higher than
the other 10, as shown in Figure 4C and 4D.
Figure 4 Test of transgenic lines on genome a d transcriptome
level
Note: A: PCR test result of the transgenic lines(1-8); 9: Positive
control,10.negative control; B: Southern Blot test results of the
transgenic lines (1~8) showing PCR positive; 9: Positive control;
10: Negative control; C and D: RT-PCR test results of
glg
B
mRNA; M: 2 kb DNA molecular weight standard; W: Negative
control; P: Positive c ntrol; 1~11: ZHB transgenic lines; 12~18:
Transgenic lines
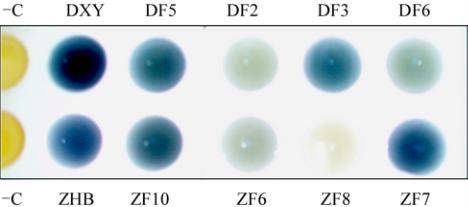
1.4 Stain of starches from transgenic lines
Minitubers, weight between 2 g and 5 g were harvested
from 15 transgenic lines: 6 from DXY host lines, and
9 from ZHB host lines. Based on the starch staining,
15 transgenic lines were divided into 2 categories. 8
lines fall into the first category, as starch strained from
those lines remained blue, but lighter than their
positive control, such as lines of DF5 and DF3 from
DXY host, and lines of ZF10 and ZF7 from ZHB host.
The other 8 lines are in the second category, as starch
strained from those lines turned light blue, such as
DF2 and DF6 from DXY host, and ZF6 and ZF8 from
ZHB host. Typical color results were partially shown
in Figure 5.
Figure 5 Lugol staining results of the starches from transgenic
lines
Note: -C is water and Lugol
1.5 Starch viscosity and amylose content of tuber
from transgenic lines
Based on results of starch staining, 8 lines with typical
blue and light blue, 4 from DXY host and 4 from ZHB
host were selected for analysis of starch viscosity and
amylose contents. In the line of DXY genotype
expressing
glg
B, the highest starch viscosity, 388.06
mPa.s occurred in the line of DF6, which was 12
times higher than the control. Starch viscosity of DF3
and DF6 were much higher than DF5 and DF2, and
also significantly higher than the control (p<0.01).
In the group with ZHB genotype as the host expressing
glg
B, the highest starch viscosity, from the line ZF7
was 212.46 mPa.s, which was 15 times higher than the
control; viscosity of ZF7 and ZF8 were significantly
higher than that of ZF6 and ZF10, as well as the control
group (p<0.01), as shown in Figure 6.
Starch viscosity of the 8 transgenic lines varied
between 36.12 mPa.s and 388.06 mPa.s.
Data analysis on amylose content (AC) indicated, as
shown in figure 7 that AC in DXY host lines was
significantly higher than that in control. Among them,
the highest AC was in the line DF6 and it was 1.2
times higher than the control. ACs of the 4 transgenic
lines from ZHB host were the same as that in the
control.