Basic HTML Version


Rice Genomics and Genetics 2012, Vol.3, No.8, 50
-
54
http://rgg.sophiapublisher.com
51
LGC-Jun, by crossing LGC-1 with Koshihikari.
With the deepening of the research on molecular
biology of rice, the mechanism of mutation in rice
variety LGC-1 has been elucidated. Genetic mechanism
of LGC-1 was first investigated by Miyahara (1999) ,
and it was found that the low-glutelin trait of LGC-1
was controlled by a single dominant gene
Lgc1
. With
RFLP molecular markers, the gene was mapped
between the markers XNpb 243 and G365 on the short
arm of chromosome 2. Further research by Kusaba et
al (2003) showed that there was a 3.5 kb deletion
fragment between two highly similar glutelin genes
GluB4
and
GluB5
in LGC-1. Because of the deletion,
transcription of the
GluB4
and
GluB5
formed a hairpin
structure with an intramolecular double-stranded
RNA in the complementary region. Then, the
double-stranded RNA induced RNA interference
against transcripts of the
GluB
gene subfamily,
resulting in conspicuous suppression of GluB protein
accumulation in LGC-1.
At present, the gene
Lgc1
has become an important
breeding resource in low glutelin content of functional
rice, and mutation mechanism of
Lgc1
is clear.
According to a 3.5 kb deletion fragment in the low
glutelin-content rice, we attempted to develop
molecular markers of the target gene. In this way, the
efficiency of gene selection can obviously be improved.
1 Result and Analysis
1.1 Genetic analysis of low glutelin content in F
2
of
W3660/Nanjing 46
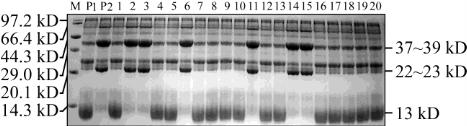
The protein profile analysis showed that W3660 had
dense bands of prolamine (13 kD), thin bands of
acidic subunits (37~39 kD) and basic subunits
(22~23 kD) of the mature glutelin, compared with
normal rice variety Nanjing 46. In 303 F
2
seeds of
W3660/Nanjing 46, 217 of low glutelin and 86 of
nomal individuals, the segregation of types showed a
good fit to a 3:1 ratio (χ
2
=1.673), which obviously
indicated that the low glutelin-content trait was
controlled by a single dominant gene. The result was
completely consistent with the conclusion reported by
Miyahara (1999); Partial individual F
2
seeds by
SDS-PAGE were shown in Figure 1, which showed
that 2, 3, 6, 11, 14, 15 individuals were normal and the
others were mutant in glutelin character.
Figure 1 SDS-PAGE analysis of total protein in partial
individual plants in F
2
of W3660/Nanjing46
Note: M: Protein marker; P1: W3660; P2: Nanjing46; 1~20:
Individual plants of F
2
1.2 Design and validation of two indel markers
based on gene
Lgc1
Compared with the normal rice, research confirmed
that there was a 3.5 kb deletion fragment between
GluB4
and
GluB5
in
Lgc1
(Kusaba et al., 2003).
According to the fact, two InDel markers, named
InDel-Lgc1-A and InDel-Lgc1-B, were designed by
the Primer Premier 5.0 software in the study. The
sequences of primers were as follows: 5'
-
AAATGTAT
GGTCGCTCAATCG
-
3' and 5'
-
TGTGCAAGGGAGG
AAGATAGC
-
3' for InDel-Lgc1-A; 5'
-
AAATGTATGG
TCGCTCAATCG
-
3' and 5'
-
CATCAGTGTTGGGAAT
GTCG
-
3' for InDel-Lgc1-B. In the above two pairs of
primers, the 5'
-
AAATGTATGGTCGCTCAATCG
-
3'
was a common primer sequence obviously (Figure 2).
Firstly, F
2
materials of W3660 / Nanjing 46 were used
for PCR amplification with the marker InDel-Lgc1-A.
The electrophoresis detection showed that all of them
amplified only one band, 4 328 bp or 828 bp, lacking
of hybrid type, presenting the characteristics of
dominant marker. In order to make the heterozygous
genotype to perform, we further developed a new
primer in the absence of fragment. It was used with
one of InDel-Lgc1-A to form a pair primers
InDel-Lgc1-B, which amplified fragment size was
1 573 bp. Therefore, the detection was carried out
with three primers to form two pairs of markers in the
same PCR reaction system. The results showed that
the
type appeared just as what we
expected. In other words, products amplified in F
2
can
be divided into three band types: namely low glutelin
Lgc1 parent W3660 (828 bp), normal parent Nanjing
46 (1 573 bp) and heterozygous
(828 bp and
1 573 bp) (Figure 3). In the F
2
population, PCR results
indicated that a 1:2:1 segregation ratio (78 mutants: